Interest Rate and GDP Dashboard by toodegreesDescription:
The Interest Rate and GDP Dashboard is a powerful tool designed to provide traders with valuable insights into Interest Rate and Gross Domestic Product (GDP) of the largest Central Banks.
Interest Rates are closely monitored from all around the world, and play a massive role in Interbank Institutional Trading. Although mainly used by Forex traders, it's important for all types of analysts to understand risk-on and risk-off environments in respective currencies, or other asset classes, based on a global financial landscape.
Forex Pair Dashboard ( FOREXCOM:EURUSD ):
Non-Forex Pair Dashboard ( CME_MINI:ES1! ):
This tool displays the Live Interest Rates (as well as latest Interest Rate Change) and GDP, of the following countries/regions:
Australia
Canada
Europe
Japan
New Zealand
Switzerland
United Kingdom
United States
Further, analysts will be able to see Interest Rate Change labels directly on chart, to monitor Time and price relationship following rate hikes or rate cuts. The labels will display according to the impact of the Interest Rate Change on the current asset on chart, and their tooltips will display the %Change:
Analysts can also choose to mark Interest Rate Changes with vertical lines, to aid in marking changes in sentiment or global financial environment:
The real power and value provided by this tool is its tailored Interest Rate (and GDP) Differential feature for Forex markets, based on the Interest Rate Differential concept as taught by the Inner Circle Trader (ICT).
Using Interest Rate Differentials as a further Long Term Bias factor was introduced by ICT in conjunction with other higher Timeframe principles like Seasonal Tendency, Commitment of Traders, and Open Interest. This fusion ensures a holistic approach to dissecting specific Forex pairs, and the involvement of Institutional traders.
Key Features:
Dynamically calculates and organizes the dashboard to display the interest rate differential of the chart's forex pair, or displays all if outside of forex markets.
Pinpoint historical interest rate changes with precision using vertical lines and/or dynamic labels with tooltips.
Other Features:
Toggle Options: Customize your viewing experience by toggling the display of previous rate changes, enabling or disabling GDP visibility, and tailoring the size and location of the dashboard.
Fine-tune Visuals: Adjust the size and style of the previous interest rate labels and lines to suit your preferences, offering a personalized touch to your analytical workspace.
Usage Guidance:
Add the Interest Rate and GDP Dashboard to your Tradingview chart.
Tailor your experience by customizing the table and style to be in line with your analytical preferences, ensuring a visually engaging and personalized chart.
Observe where and when key Interest Rate decisions impact the macro trend or market environment.
Leverage this invaluable information to shape your Higher Timeframe narrative in confluence with other tools.
Cari dalam skrip untuk "Inner circle trader "

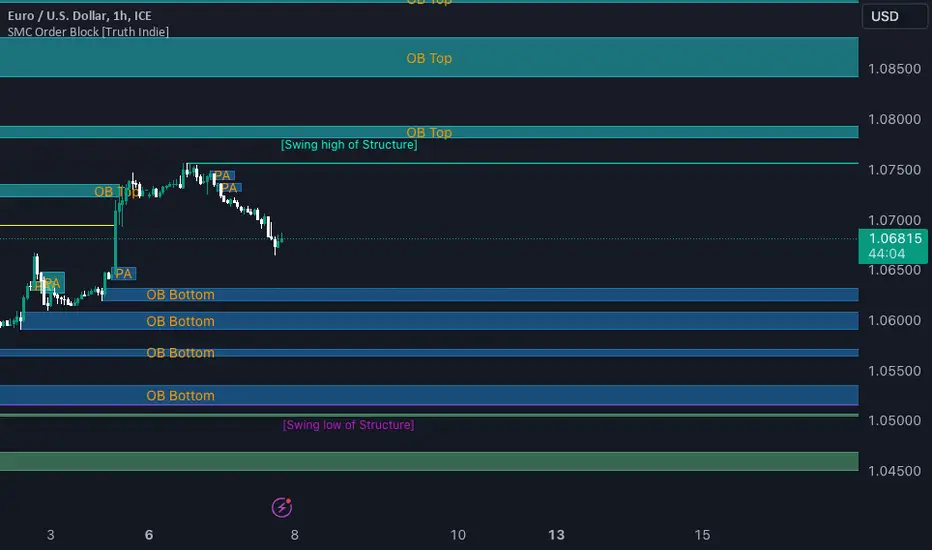
SMC Order Block [Truth Indie]Smart Money Concept (SMC)
For me, SMC is a trading philosophy that stems from those with knowledge and understanding of the structure of the Smart Money group's trading system. It is developed through the observation of price behavior.
SMC is related to the Smart Money group or those entities that can influence the market, such as financial institutions, banks, or funds. Market movements are often driven by market fundamentals or economics. The Smart Money group possesses extensive research data for analyzing the market's fundamentals and has the ability to steer the market in various directions based on market and economic fundamentals at a given time.
The SMC concept is adapted from the ICT concept, and it was developed and shared by The Inner Circle Trader.
I have been studying and trying to understand SMC for some time, and I have many questions I would like to explore. The challenge lies in the fact that different sources of knowledge on this topic often have varying teachings, and my proficiency in the English language is limited. As a result, I haven't had the opportunity to study from the primary source, The Inner Circle Trader.
This indicator was created for the purpose of researching Market Structure and Order Blocks, which are integral parts of the SMC Concept.
The fundamental principle for identifying Order Blocks is as follows:
1.Locate swings that create candlestick imbalances.
2.An imbalance refers to a candlestick that is larger than the preceding one and contains a Fair Value Gap (FVG).
This indicator categorizes Order Blocks into four types, and you are encouraged to customize them to suit your preferences.
OB Type1
1.The closing price of candle has an opposite direction to the candle .
2.Candle has a wick longer than its body, by at least 1 times or more (adjustable).
3.Candle has a wick longer than candle , by at least 2 times or more (adjustable).
4.There is a Fair Value Gap (FVG) between the wicks of candle and .
OB Type1_HTF
-This condition is the same as OB Type1, but it involves analyzing 6 candles instead. This means looking at a larger time frame, twice as big as the original one.
OB Type2
1.The closing price of candle has the opposite direction to candle .
2.Candle has a body larger than its wick by at least 1 times or more (adjustable).
3.Candle has a body larger than candle by at least 2 times or more (adjustable).
4.There is a Fair Value Gap (FVG) between the wicks of candle and .
OB Type2_HTF means observing a larger time frame, specifically twice as big as the previous one.
OB Type3
1.The closing price of candle has the same direction as candle .
2.Candle has a wick longer than its body, by at least 1 times or more (adjustable).
3.Candle has a wick longer than candle , by at least 2 times or more (adjustable).
4.There is a Fair Value Gap (FVG) between the wicks of candle and .
OB Type3_HTF means observing a larger time frame, specifically twice as big as the previous one.
OB Type4
1.The closing price of candle has the same direction as candle .
2.Candle has a body larger than its wick by at least 1 times or more (adjustable).
3.Candle has a body larger than candle by at least 2 times or more (adjustable).
4.There is a Fair Value Gap (FVG) between the wicks of candle and .
OB Type4_HTF is an indicator that involves looking at a larger time frame, specifically twice as big as the original one.
Order Block Setting
1.Click to activate the OB search in different Types.
2.Adjust the body of the candle .
3.Adjust the strength of the candle or the Imbalance candle.
4.You can change the name of OB.
5.Adjust the font size and color.
6.Adjust the color of the OB BOX and History BOX.
7.Adjust the font of OB HTF.
1.It refers to the value of W for a specific candle.
2.It refers to the value of Im for a specific candle.
3.It refers to the values of W and Im in the HTF.
4.For OB Type1 and Type3, a higher W value will search for candles with a larger wick and a smaller body. When the W value is lower, it will search for candles with a smaller wick and a larger body, moving from low to high.
5.For OB Type2 and Type4, a lower W value will search for candles with a smaller wick and a larger body. When the W value is higher, it will search for candles with a larger wick and a smaller body, moving from high to low.
Market Structure
Comprising the process of breaking the price structure, resulting in BOS (Breakout of Structure) or CHoCH (Change of Character High), and creating new High or Low based on the price structure.
1.When the market forms a price structure with High and Low, when the price moves to disrupt the structure in either direction, it will lead to BOS or CHoCH, resulting in a new High or Low. You can adjust the method of breaking the structure using the close, high, or low.
2.When you break the price structure, a High or Low will be formed on one side, and it will lead to an Inducement Swing. When the price moves and collides, it will create a price range of High and Low. You can adjust the method of breaking the structure using the close, high, or low.
3.There is an option for testing Fibonacci (Fibo). Its function is similar to the Inducement Swing. You can adjust the Fibonacci settings.
Premium & Discount Zone
1.The Premium & Discount Zone will appear based on the current price structure. It helps you see the price zones you are interested in.
2.You can adjust the %Premium & Discount as needed.
3.The OB (Order Block) will be displayed when a price structure of High and Low forms within the Premium & Discount Zone. The OB in this indicator is not a recommendation to buy or sell. You need to research and test various conditions before making trading decisions.
Everyone's trading strategies are different, and it comes down to backtesting and selecting the strategy that suits your individual needs. Hopefully, this indicator will assist the TradingView community of traders in their trading endeavors.
ICT Donchian Smart Money Structure (Expo)█ Concept Overview
The Inner Circle Trader (ICT) methodology is focused on understanding the actions and implications of the so-called "smart money" - large institutions and professional traders who often influence market movements. Key to this is the concept of market structure and how it can provide insights into potential price moves.
Over time, however, there has been a notable shift in how some traders interpret and apply this methodology. Initially, it was designed with a focus on the fractal nature of markets. Fractals are recurring patterns in price action that are self-similar across different time scales, providing a nuanced and dynamic understanding of market structure.
However, as the ICT methodology has grown in popularity, there has been a drift away from this fractal-based perspective. Instead, many traders have started to focus more on pivot points as their primary tool for understanding market structure.
Pivot points provide static levels of potential support and resistance. While they can be useful in some contexts, relying heavily on them could provide a skewed perspective of market structure. They offer a static, backward-looking view that may not accurately reflect real-time changes in market sentiment or the dynamic nature of markets.
This shift from a fractal-based perspective to a pivot point perspective has significant implications. It can lead traders to misinterpret market structure and potentially make incorrect trading decisions.
To highlight this issue, you've developed a Donchian Structure indicator that mirrors the use of pivot points. The Donchian Channels are formed by the highest high and the lowest low over a certain period, providing another representation of potential market extremes. The fact that the Donchian Structure indicator produces the same results as pivot points underscores the inherent limitations of relying too heavily on these tools.
While the Donchian Structure indicator or pivot points can be useful tools, they should not replace the original, fractal-based perspective of the ICT methodology. These tools can provide a broad overview of market structure but may not capture the intricate dynamics and real-time changes that a fractal-based approach can offer.
It's essential for traders to understand these differences and to apply these tools correctly within the broader context of the ICT methodology and the Smart Money Concept Structure. A well-rounded approach that incorporates fractals, along with other tools and forms of analysis, is likely to provide a more accurate and comprehensive understanding of market structure.
█ Smart Money Concept - Misunderstandings
The Smart Money Concept is a popular concept among traders, and it's based on the idea that the "smart money" - typically large institutional investors, market makers, and professional traders - have superior knowledge or information, and their actions can provide valuable insight for other traders.
One of the biggest misunderstandings with this concept is the belief that tracking smart money activity can guarantee profitable trading.
█ Here are a few common misconceptions:
Following Smart Money Equals Guaranteed Success: Many traders believe that if they can follow the smart money, they will be successful. However, tracking the activity of large institutional investors and other professionals isn't easy, as they use complex strategies, have access to information not available to the public, and often intentionally hide their moves to prevent others from detecting their strategies.
Instantaneous Reaction and Results: Another misconception is that market movements will reflect smart money actions immediately. However, large institutions often slowly accumulate or distribute positions over time to avoid moving the market drastically. As a result, their actions might not produce an immediate noticeable effect on the market.
Smart Money Always Wins: It's not accurate to assume that smart money always makes the right decisions. Even the most experienced institutional investors and professional traders make mistakes, misjudge market conditions, or are affected by unpredictable events.
Smart Money Activity is Transparent: Understanding what constitutes smart money activity can be quite challenging. There are many indicators and metrics that traders use to try and track smart money, such as the COT (Commitments of Traders) reports, Level II market data, block trades, etc. However, these can be difficult to interpret correctly and are often misleading.
Assuming Uniformity Among Smart Money: 'Smart Money' is not a monolithic entity. Different institutional investors and professional traders have different strategies, risk tolerances, and investment horizons. What might be a good trade for a long-term institutional investor might not be a good trade for a short-term professional trader, and vice versa.
█ Market Structure
The Smart Money Concept Structure deals with the interpretation of price action that forms the market structure, focusing on understanding key shifts or changes in the market that may indicate where 'smart money' (large institutional investors and professional traders) might be moving in the market.
█ Three common concepts in this regard are Change of Character (CHoCH), and Shift in Market Structure (SMS), Break of Structure (BMS/BoS).
Change of Character (CHoCH): This refers to a noticeable change in the behavior of price movement, which could suggest that a shift in the market might be about to occur. This might be signaled by a sudden increase in volatility, a break of a trendline, or a change in volume, among other things.
Shift in Market Structure (SMS): This is when the overall structure of the market changes, suggesting a potential new trend. It usually involves a sequence of lower highs and lower lows for a downtrend, or higher highs and higher lows for an uptrend.
Break of Structure (BMS/BoS): This is when a previously defined trend or pattern in the price structure is broken, which may suggest a trend continuation.
A key component of this approach is the use of fractals, which are repeating patterns in price action that can give insights into potential market reversals. They appear at all scales of a price chart, reflecting the self-similar nature of markets.
█ Market Structure - Misunderstandings
One of the biggest misunderstandings about the ICT approach is the over-reliance or incorrect application of pivot points. Pivot points are a popular tool among traders due to their simplicity and easy-to-understand nature. However, when it comes to the Smart Money Concept and trying to follow the steps of professional traders or large institutions, relying heavily on pivot points can create misconceptions and lead to confusion. Here's why:
Delayed and Static Information: Pivot points are inherently backward-looking because they're calculated based on the previous period's data. As such, they may not reflect real-time market dynamics or sudden changes in market sentiment. Furthermore, they present a static view of market structure, delineating pre-defined levels of support and resistance. This static nature can be misleading because markets are fundamentally dynamic and constantly changing due to countless variables.
Inadequate Representation of Market Complexity: Markets are influenced by a myriad of factors, including economic indicators, geopolitical events, institutional actions, and market sentiment, among others. Relying on pivot points alone for reading market structure oversimplifies this complexity and can lead to a myopic understanding of market dynamics.
False Signals and Misinterpretations: Pivot points can often give false signals, especially in volatile markets. Prices might react to these levels temporarily but then continue in the original direction, leading to potential misinterpretation of market structure and sentiment. Also, a trader might wrongly perceive a break of a pivot point as a significant market event, when in fact, it could be due to random price fluctuations or temporary volatility.
Over-simplification: Viewing market structure only through the lens of pivot points simplifies the market to static levels of support and resistance, which can lead to misinterpretation of market dynamics. For instance, a trader might view a break of a pivot point as a definite sign of a trend, when it could just be a temporary price spike.
Ignoring the Fractal Nature of Markets: In the context of the Smart Money Concept Structure, understanding the fractal nature of markets is crucial. Fractals are self-similar patterns that repeat at all scales and provide a more dynamic and nuanced understanding of market structure. They can help traders identify shifts in market sentiment or direction in real-time, providing more relevant and timely information compared to pivot points.
The key takeaway here is not that pivot points should be entirely avoided or that they're useless. They can provide valuable insights and serve as a useful tool in a trader's toolbox when used correctly. However, they should not be the sole or primary method for understanding the market structure, especially in the context of the Smart Money Concept Structure.
█ Fractals
Instead, traders should aim for a comprehensive understanding of markets that incorporates a range of tools and concepts, including but not limited to fractals, order flow, volume analysis, fundamental analysis, and, yes, even pivot points. Fractals offer a more dynamic and nuanced view of the market. They reflect the recursive nature of markets and can provide valuable insights into potential market reversals. Because they appear at all scales of a price chart, they can provide a more holistic and real-time understanding of market structure.
In contrast, the Smart Money Concept Structure, focusing on fractals and comprehensive market analysis, aims to capture a more holistic and real-time view of the market. Fractals, being self-similar patterns that repeat at different scales, offer a dynamic understanding of market structure. As a result, they can help to identify shifts in market sentiment or direction as they happen, providing a more detailed and timely perspective.
Furthermore, a comprehensive market analysis would consider a broader set of factors, including order flow, volume analysis, and fundamental analysis, which could provide additional insights into 'smart money' actions.
█ Donchian Structure
Donchian Channels are a type of indicator used in technical analysis to identify potential price breakouts and trends, and they may also serve as a tool for understanding market structure. The channels are formed by taking the highest high and the lowest low over a certain number of periods, creating an envelope of price action.
Donchian Channels (or pivot points) can be useful tools for providing a general view of market structure, and they may not capture the intricate dynamics associated with the Smart Money Concept Structure. A more nuanced approach, centered on real-time fractals and a comprehensive analysis of various market factors, offers a more accurate understanding of 'smart money' actions and market structure.
█ Here is why Donchian Structure may be misleading:
Lack of Nuance: Donchian Channels, like pivot points, provide a simplified view of market structure. They don't take into account the nuanced behaviors of price action or the complex dynamics between buyers and sellers that can be critical in the Smart Money Concept Structure.
Limited Insights into 'Smart Money' Actions: While Donchian Channels can highlight potential breakout points and trends, they don't necessarily provide insights into the actions of 'smart money'. These large institutional traders often use sophisticated strategies that can't be easily inferred from price action alone.
█ Indicator Overview
We have built this Donchian Structure indicator to show that it returns the same results as using pivot points. The Donchian Structure indicator can be a useful tool for market analysis. However, it should not be seen as a direct replacement or equivalent to the original Smart Money concept, nor should any indicator based on pivot points. The indicator highlights the importance of understanding what kind of trading tools we use and how they can affect our decisions.
The Donchian Structure Indicator displays CHoCH, SMS, BoS/BMS, as well as premium and discount areas. This indicator plots everything in real-time and allows for easy backtesting on any market and timeframe. A unique candle coloring has been added to make it more engaging and visually appealing when identifying new trading setups and strategies. This candle coloring is "leading," meaning it can signal a structural change before it actually happens, giving traders ample time to plan their next trade accordingly.
█ How to use
The indicator is great for traders who want to simplify their view on the market structure and easily backtest Smart Money Concept Strategies. The added candle coloring function serves as a heads-up for structure change or can be used as trend confirmation. This new candle coloring feature can generate many new Smart Money Concepts strategies.
█ Features
Market Structure
The market structure is based on the Donchian channel, to which we have added what we call 'Structure Response'. This addition makes the indicator more useful, especially in trending markets. The core concept involves traders buying at a discount and selling or shorting at a premium, depending on the order flow. Structure response enables traders to determine the order flow more clearly. Consequently, more trading opportunities will appear in trending markets.
Structure Candles
Structure Candles highlight the current order flow and are significantly more responsive to structural changes. They can provide traders with a heads-up before a break in structure occurs
-----------------
Disclaimer
The information contained in my Scripts/Indicators/Ideas/Algos/Systems does not constitute financial advice or a solicitation to buy or sell any securities of any type. I will not accept liability for any loss or damage, including without limitation any loss of profit, which may arise directly or indirectly from the use of or reliance on such information.
All investments involve risk, and the past performance of a security, industry, sector, market, financial product, trading strategy, backtest, or individual's trading does not guarantee future results or returns. Investors are fully responsible for any investment decisions they make. Such decisions should be based solely on an evaluation of their financial circumstances, investment objectives, risk tolerance, and liquidity needs.
My Scripts/Indicators/Ideas/Algos/Systems are only for educational purposes!

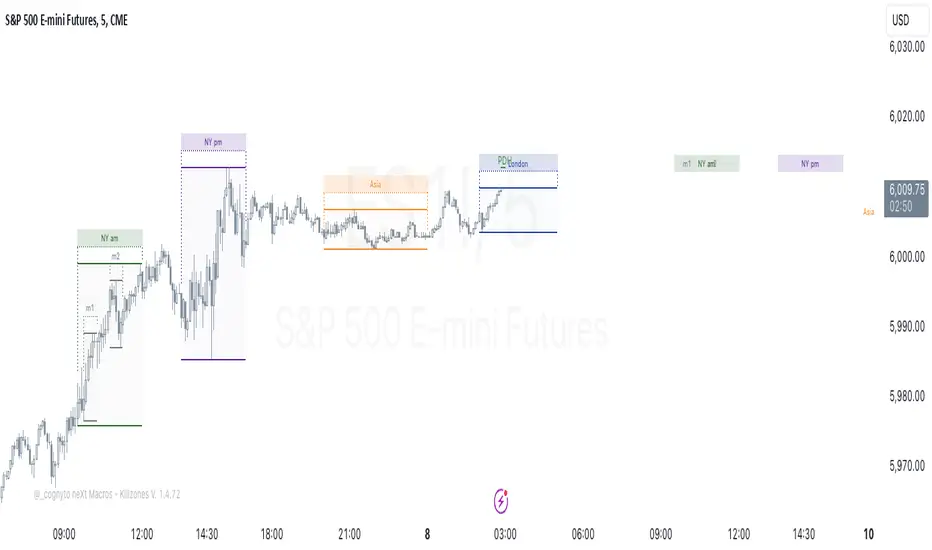
neXt Macros - Killzones [cognyto]The MACRO indicator is a valuable tool for traders who want to develop consistency and believe that major macroeconomic events occur at certain times of the day that can affect the market. By showing macro times in advance, allowing alerts to be triggered, and showing previous macros that have occurred, the MACRO indicator provides traders with the information they need to make more informed trading decisions that can be used in conjunction with their own strategies.
What is a MACRO?
A MACRO is a concept introduced by Micheal Huddleston, known as ICT, the -Inner Circle Trader- and he is the one to thank for. It represents some short periods of time during the day that can be used as an advantage for trading due to major economic events, or when the price reaches a certain level of relevance. The indicator is a tool that visually highlights these important periods in advance.
Some of the features of the MACRO indicator are:
The indicator highlights IN ADVANCE the relevant segments of time during the day, known as MACROS. It allows the trader to monitor the price precisely at these times and potentially identify trading opportunities according to his own strategies. All Macro times in the indicator can be modified, enabled or disabled. It is likely that not all MACROS will be relevant to all instruments, so it is recommended that only those relevant to the trader's instrument or market preferences are enabled, disabled or the times adjusted. The News checkbox helps traders to visualise, in a different color, those macros where news are expected to be published and may cause unpredictable high volatility, so it is advisable to have high precautions or as suggested by ICT: "DO NOT TRADE DURING THOSE TIMES OR DAYS !!! " Please note that this feature is optional to be used but certainly has to be updated on a daily basis, since not all days occur the same news events.
In addition to this, it also allows the trader to set the number of minutes that alerts are to be triggered before the start of the next MACRO. This feature allows traders to review, analyse and trade ONLY during MACRO times and prevent them from constantly monitoring the screen. This feature can be of great value to those who need the discipline to gain consistency and only trade when the time is relevant. Please note that the alerts are not triggered by the indicator, this can only be done through TradingView. The checkbox only indicates that the trader wishes to receive alerts of those MACRO times that are enabled. Therefore, it is HIGHLY SUGGESTED to set the alerts in TradingView to the 1 minute timeframe in order to have the required precision for alarming.
Finally, the MACRO indicator also displays previous macros that have occurred in the last few days and with severe settings that allow the trader to precisely implement different strategies. This feature allows traders to back test and analyse the relevance of past macros. By understanding how the market has reacted to similar events in the past, traders can make more informed decisions about how to trade current and future events.
Remember that your cognitive balance is essential and this indicator aims to help you manage your TIME and reduce anxiety by sticking to your rules.
This indicator is for informational purposes only and you should not rely on any information it provides as legal, tax, investment, financial or other advice. Nothing provided by this indicator constitutes a solicitation, recommendation, endorsement or offer by cognyto or any third party service provider to buy or sell any securities or other financial instruments in this or any other jurisdiction in which such solicitation or offer would be unlawful under the securities laws of such jurisdiction.
Price Action All In One IndicatorIf you are the one who is "Price Action" style & does not want to use many indicators or complex indicators or you are an ICT (The Inner Circle Trader)
student or ICT charter, this simple beautiful All In One Indicator is right for you.
The indicator has the following functions.
TIME ZONE SETTING
The default timezone is New York Time GMT-4, if you leave the time zone setting blank, it will use the symbol timezone. Note that the trading time changes with one hour delay in winter. so if you just trade forex, and leave the time zone setting blank, TradingView will adjust the symbol timezone automatically for you or don't forget to change the timezone setting GMT-4 or GMT-5 depending on daylight saving time.
STATISTIC PANEL
You can choose which panel to show through settings.
Session Info Panel : pips info of ADR, Asian, London, and New York sessions.
Trend Panel : showing trend (up/down) of
5m/15m/1h/4h/D/W time frames (TF)
4MA (default values: SMA with lengths: 20–50–100–200)
Money Management Panel : in trading, money management is very important. Just put the % risk, & stop loss value below, the indicator will calculate a suitable size/amount for each trade.
Size by Lots: input stop loss in pips
Size by Units: input stop loss in % (of price)
(*)Units size is calculated by % stop loss & current bar close price. You have to determine a stop-loss price to convert to % stop loss by yourself.
TIME SEPARATORS
We can choose which time separators we want to display. The indicator has 5 options: Anchor Time/Day/Week/Month/Quarter. Of course, we can choose to show just one or all 5 of them.
With Anchor Time you can choose which time you want to draw a vertical line for better timing analysis. This can show up to 2 Anchor Time lines. The default values are 00:00 (New York Midnight Opening) and 08:30 (New York Session Opening). You also have an option to show the past lines or not.
About Day Separator, cause TradingView has supported Session Breaks in Setting but if you don't like to use it or when enabling, it distracts you, you can use mine. My favorite trading dates are Tuesday & Wednesday.
PRICE LEVELS
For intraday trading, the high/low/close of the previous day, the previous week, ADR (default period is 5) are very important key levels. You can choose which one you like to show for better analysis. Of course, you can change the color & style of the lines. This is also my favorite indicator.
This indicator also has an option to show up to 2 price lines at a specific time, you can choose the price type (high/low/close/open) that you want to display. The default time values are:
Specific Time 1: 0:00. (New York Midnight Opening Price)
Specific Time 2: 8:30 am. (New York Session Opening Price)
ACCUMULATION ZONE
The market tends to reprice the higher/lower to the old high/low or imbalance/fair value price to promote buy/sell stops or to provide smart money pricing for long/short entries. Typically, it redistributes quickly and you must learn to anticipate them at key levels intraday. Weak short/long holders will be squeezed in the retracement.
Except for the open price, the price changes continuously until the closing time, so the accumulation area can also be changed in real-time, but if you combine it with other information when analyzing, you can predict/determine whether the zone has been established or not with high probability. In short, price needs time to be accumulated, I usually don't pay attention to this daily zone till London open/close or New York sessions
Not only daily zone, but the indicator also supports higher timeframes accumulation zone from
SESSION & STD
There are 3 sessions: Asian, London, New York. The default values are below (New York Time).
Asian: 19:00 ~ 00:00
London Open (London KillZone): 01:00 ~ 05:00
New York Open (New York KillZone): 07:00 ~ 10:00
If you do not want to show the label, just leave the label values blank or change them to whatever you want.
This is one of my favorite functions. I use it on 15m, 30m, 1h TF for Forex intraday trading. My favorite trading sessions are London Open & New York Open.
You also can choose to show or not Standard Deviations (STD). The default values are set for Asian Range STD and max STD levels can be shown are 5. I use the following 3 types of STD (New York Time):
CBDR (Central Bank Deviations) STD: 14:00 ~ 20:00
Flout STD: 15:00 ~00:00
Asian Range STD: 19:00 ~ 00:00
LOOKBACK HIGH/LOW/MID
Can show high/low/mid of the data ranges on the daily/4h chart. The default values are:
- 20–40–60 days back from today for daily TF.
- 30–60–90 bars back from the latest bar for 4h TF.
The default anchor bar for calculating the lookback is the latest one but with:
- 4h TF: we can change the lookback from the 1st day of the week.
- Daily TF: we can change the lookback from the 1st day of the month.
The indicator also has options showing the high/low/mid (equilibrium level) lines for better analysis. Especially, on daily TF, we have the option that can show up to 4 lines (25% for each one) of the data range.
Of course, you can change the colors or the style of the high/low/mid lines.
The lookback can be shown on the lower TFs for better detection when the market structure is shifted.
MAGIC BARS
Fractal bar : The bar's color is changed when the divergence occurs between the price & RSI. You can change the RSI period (default value is 14) & RSI source. (open/high/low/close,…)
Imbalance bar or liquidity void or fair value gap - whatever you call it. This is my favorite indicator when trading on all TFs.You can choose to extend the last n imbalance bars if you like in the settings. I make sure I covered all cases of imbalance/fair value gap.
OLD HIGH/LOW
First, this function is not used as the common Support & Resistance that retail traders usually use, so I call it Old High/Low. I usually use it in 2 ways:
Detect the next buy/sell stops that Market Makers aim to manipulate.
Detect whether market structure shifted or not (Break of structure)
In settings you can:
Set the period to detect high/low levels, the default value is 10. My other favorite values are 6 & 2.
On a lower time frame, you might want to set it to a large number to remove noise.
On a higher time frame, a small number is enough, I think.
Choose the numbers of the last lines you want to show on your chart.
Of course, the style of lines can be changed easily.
TRENDLINES
A very simple trendline with default pivot left strength is 10.
By default, trendline uses high/low price but you have the "Using close price" option.
LINEAR REGRESSION CHANNEL
The Linear Regression Channel is a three-line technical indicator used to analyze the upper and lower limits of an existing trend. It is a statistical tool used to predict the future from past data and is used to determine trend direction or when prices may be overextended.
You can choose
To fill the background or not
To show inner/outer lines or not
To change the colors/line styles of upper zone, lower zone, upper lines, lower lines, midline
DIRECTION BOX
Working on all TFs, this looks like the same with lookback function but if you would like to display them in a box for easily focusing/comparing with other symbols or for detecting divergence in a specific period. The indicator also has a setting to show or hide lines connecting between lows or highs.
Another example of how I use High/Low connecting lines to detect divergence between S&P 500 and NASDAQ 100.
ZIG ZAG
Can show up to 2 ZigZag lines.
This is suitable for traders who have difficulty in detecting key levels (recent high/low) of the prices to confirm market structure or just for drawing Fibonacci easily at those levels.
MA (Moving Average)
I believe that this is one of the most used indicators for every trader. There are 5 types of MA to choose from: EMA, SMA, WMA, VWMA, SMMA(RMA).
This can show up to 4 MAs. You can choose the source (close/high/low,…) for each one. My favorite values are 34 & 89 EMA.
This indicator also supports MA Bands. You can select which MA you want to display the bands, and the "width" of the bands can be changed via the settings.
WATERMARK
It's just a simple function but I think it's very useful for those who want to add Copyright info to the chart, to prevent others from copying it.
Others/known issues/limitations
In forex or stock (things that are traded only on weekdays), TradingView's does not include the latest bars till Monday so the Day Separator cannot fill that space. Because TradingView deals with those bars as Sunday's ones so I set the color of Sunday the same as Friday for good UI/UX. On Crypto charts, the indicator shows without problems.
If you see "Internal server study error", please try closing the current TradingView tab in your browser and reopening it in a new tab. The error will disappear.
Because TradingView does not provide any detailed error information when such "general error" occurs. It's very difficult to detect which function is causing this error or is there something that caused TradingView "overloaded" through a long time running/loading on that tab? Honestly, I don't know exactly the cause, but in my experience, this error often occurs in the following cases:
When you have the TradingView Tab open for hours. In my case, I usually leave TradingView tab open overnight & when I come back the next day, this error might appear. (I'm a Mac user & I almost never shut down my Mac)
When you change settings too many times, especially settings of drawing objects like line width in a using session, it might cause this error.
So, after changing the setting or when you come back for the next trade, please save & close that TradingView tab, and then open a new one, everything will work fine.
You can see the images below that show I have tested my indicator from 1-minute time frame, enabled all functions, change every setting to max values & everything still works fine.

Liquidity Pools Smart Entry + Multi-TF Targets + VWAPOverview
This indicator is designed to help traders identify high-probability institutional-style entries using concepts from ICT (Inner Circle Trader) methodology. It combines liquidity pool detection, fair value gaps (FVG), swing levels, killzones, ATR-based targets, VWAP bias, and optional multi-timeframe analysis.
The script provides visual trade signals and a green-light confirmation system to streamline decision-making and reduce overtrading.
Key Features
Market Structure
Detects CHoCH (Change of Character) and BOS (Break of Structure).
Marks bullish and bearish breaks with labels on the chart.
Liquidity & Swings
Highlights Swing High/Low liquidity zones (SSL/BSL).
Shows horizontal swing lines for reference.
Fair Value Gap (FVG) Detection
Bullish and bearish gaps are plotted as shaded boxes.
Identifies potential institutional entry zones.
Killzones
Highlights London and New York sessions.
Helps align trades with high liquidity periods.
VWAP Filter
Plots the intraday VWAP.
Optional VWAP bias filter ensures trades follow intraday institutional flow.
Multi-Timeframe Confirmation
Supports 5-minute entry confirmation.
Shows SL/TP for both current TF and 5-min TF signals.
ATR-Based Stops & Targets
Entry signals automatically calculate SL (1.5 ATR) and TP (ATR x multiplier).
Customizable ATR multiplier.
Trade Light System
Visual green/red/gray indicators:
🟢 Green: All bullish conditions aligned → LONG allowed.
🔴 Red: All bearish conditions aligned → SHORT allowed.
⚪ Gray: Wait → conditions not aligned.
Inputs
Input Description
Show CHoCH/BOS Toggle structure labels on/off
Show Killzones Toggle session backgrounds on/off
Show Swing Liquidity Show SSL/BSL swing points
Show Horizontal Lines Extend swing lines horizontally
Show FVG Zones Show Fair Value Gaps
Show VWAP Display intraday VWAP
Swing Length Number of bars to calculate swing pivots
ATR Target Multiplier Multiplies ATR for TP calculation
Use HTF 200 EMA Filter Filter entries with higher timeframe trend
Use RSI Filter Filter entries using RSI 14
Use Volume Filter Filter entries with high volume confirmation
Use ATR Filter Filter entries based on ATR expansion
Use VWAP Filter Only allow trades in VWAP direction
How to Read the Chart
Structure Labels
BOS ↑ / BOS ↓: Breaks of structure showing trend direction.
Swing Liquidity
SSL (blue): Bullish swing low liquidity.
BSL (red): Bearish swing high liquidity.
FVG Zones
Green boxes: Potential bullish liquidity gaps.
Red boxes: Potential bearish liquidity gaps.
Killzones
Green background: London session.
Blue background: New York session.
VWAP
Purple line: Intraday volume-weighted average price.
Trade Lights
🟢 Green: All bullish conditions met — LONG ready.
🔴 Red: All bearish conditions met — SHORT ready.
⚪ Gray: Wait — conditions not aligned.
Entry Labels
Shows Entry price, SL, TP.
Separate labels for current TF and 5-min confirmation.
How to Use
Step 1: Identify Market Bias
Check HTF EMA: price above → bullish trend, below → bearish trend.
Check VWAP (if enabled): trade in direction of VWAP for institutional alignment.
Check Killzones: prefer entries during London or New York sessions.
Step 2: Confirm Entry Conditions
Wait for BOS / CHoCH to align with your trend.
Look for FVG zone and SSL/BSL liquidity.
Ensure RSI, ATR, Volume, VWAP filters (if enabled) all confirm.
Green/red Trade Light should be active.
Step 3: Place Trade
Use Entry Label price as reference.
SL: 1.5 ATR away.
TP: ATR x multiplier away.
Optional: check 5-min multi-TF confirmation label for additional confidence.
Step 4: Manage Trade
Follow ATR-based SL/TP.
Move stop to break-even after partial target if desired.
Only take trades when Trade Light is GREEN (LONG) or RED (SHORT).
Best Practices
Combine with volume profile or order block analysis for higher precision.
Avoid trading outside killzones.
Use multi-TF confirmation for safer entries.
Adjust ATR multiplier according to market volatility.

Quarterly Theory The Quarterly Theory indicator is a refined analytical tool that applies the ICT (Inner Circle Trader) framework and fractal time principles. It divides market time into structured quarterly cycles, anchored by the True Open of each period, to provide precise signals for trade entry and exit. This approach is consistently effective across all timeframes—from yearly and monthly charts down to 90-minute sessions.
The core model defines four distinct market phases within each cycle:
Q1 – Accumulation: A consolidation phase where the market builds a base for the next move.
Q2 – Manipulation (Judas Swing): Characterized by deceptive, rapid price action designed to trap traders before a true trend emerges.
Q3 – Distribution: A period of high volatility as positions are unwound and transferred.
Q4 – Continuation/Reversal: The cycle concludes with the established trend either extending or reversing.
By leveraging smart algorithms, the indicator analyzes these phases to detect critical market structures such as liquidity zones, stop-runs, and high-probability price patterns. This synthesis of Quarterly Theory, fractal timing, and liquidity analysis delivers a data-driven edge, empowering traders to decode complex market behavior and execute informed, strategic trades.

SMT (ICT Concepts)Overview
Smart Money Technique (SMT) Divergence is a price action analysis method derived from Inner Circle Trader (ICT) methodology. This indicator automatically detects SMT divergences by comparing price movements across correlated financial instruments, identifying moments when assets that typically move together begin to diverge - a phenomenon often associated with potential price reversals.
An SMT divergence occurs when one instrument makes a new swing high or low while a correlated instrument fails to confirm that move. This failure to confirm suggests that the instrument may be positioning for a reversal, as the divergence indicates a lack of conviction in the current price direction across related markets.
Theoretical Foundation
What is SMT Divergence?
In correlated markets, instruments tend to move in tandem. For example, the E-mini S&P 500 (ES) and E-mini Nasdaq 100 (NQ) futures typically make swing highs and lows together due to their shared exposure to U.S. equity markets. When this correlation breaks down at key swing points, it creates an SMT divergence.
Bullish SMT Divergence:
The chart instrument creates a lower low compared to a previous swing low, while the correlated comparison instrument creates a higher low (or fails to make a lower low). This divergence at the lows suggests potential buying pressure and a possible bullish reversal.
Bearish SMT Divergence:
The chart instrument creates a higher high compared to a previous swing high, while the correlated comparison instrument creates a lower high (or fails to make a higher high). This divergence at the highs suggests potential selling pressure and a possible bearish reversal.
Why SMT Divergences Matter
SMT divergences are considered significant because they may indicate:
Accumulation or distribution occurring in one instrument but not the other
Relative strength or weakness between correlated assets
Potential exhaustion of the current trend
Early warning signs before major reversals
Indicator Features
Multi-Timeframe SMT Detection
This indicator provides simultaneous SMT detection on two timeframes:
Current Timeframe (CTF) Detection:
The indicator scans for SMT divergences on the chart's active timeframe using multiple pivot lookback periods (3, 5, 8, 13, 21, and 34 bars). This multi-period approach ensures detection of both short-term and intermediate swing points, reducing the likelihood of missing valid divergences while filtering out noise.
Higher Timeframe (HTF) Detection:
Simultaneously, the indicator monitors a higher timeframe for SMT divergences using pivot periods of 3, 5, 8, 13, and 21 HTF candles. Higher timeframe signals generally carry more significance as they represent larger market structure.
Automatic Timeframe Pairing:
When enabled, the indicator automatically selects an appropriate higher timeframe based on your chart's current timeframe:
Sub-1 minute charts pair with 5-minute
1-2 minute charts pair with 15-minute
3-4 minute charts pair with 30-minute
5 minute charts pair with 1-hour
6-9 minute charts pair with 1-hour
15 minute charts pair with 4-hour
16-59 minute charts pair with Daily
1-4 hour charts pair with Weekly
Daily charts pair with Monthly
Combined Signal Detection:
When an SMT divergence is detected on both the current timeframe and higher timeframe at the same price pivots, the indicator combines these into a single enhanced signal. Combined signals display both timeframes in the label and use the higher timeframe styling to emphasize their increased significance.
Automatic Symbol Correlation
The indicator includes comprehensive automatic symbol selection based on the instrument you are viewing. When Auto SMT is enabled, the indicator intelligently selects correlated comparison symbols.
Index Futures Correlations:
E-mini Contracts:
NQ (Nasdaq 100) compares with ES (S&P 500) and YM (Dow Jones)
ES (S&P 500) compares with NQ (Nasdaq 100) and YM (Dow Jones)
YM (Dow Jones) compares with NQ (Nasdaq 100) and ES (S&P 500)
RTY (Russell 2000) compares with ES (S&P 500) and NQ (Nasdaq 100)
Micro Contracts:
MNQ (Micro Nasdaq) compares with MES (Micro S&P) and MYM (Micro Dow)
MES (Micro S&P) compares with MNQ (Micro Nasdaq) and MYM (Micro Dow)
MYM (Micro Dow) compares with MNQ (Micro Nasdaq) and MES (Micro S&P)
M2K (Micro Russell) compares with MES (Micro S&P) and MNQ (Micro Nasdaq)
Metals Futures Correlations:
Standard Contracts:
GC (Gold) compares with SI (Silver) and PL (Platinum)
SI (Silver) compares with GC (Gold) and PL (Platinum)
PL (Platinum) compares with GC (Gold) and SI (Silver)
Micro Contracts:
MGC (Micro Gold) compares with SIL (Micro Silver) and PL (Platinum)
SIL (Micro Silver) compares with MGC (Micro Gold) and PL (Platinum)
Energy Futures Correlations:
CL (Crude Oil) compares with RB (RBOB Gasoline) and NG (Natural Gas)
RB (RBOB Gasoline) compares with CL (Crude Oil) and NG (Natural Gas)
NG (Natural Gas) compares with CL (Crude Oil) and RB (RBOB Gasoline)
MCL (Micro Crude) compares with RB (RBOB Gasoline) and NG (Natural Gas)
Major ETF Correlations:
SPY (S&P 500 ETF) compares with QQQ, DIA, and IWM
QQQ (Nasdaq 100 ETF) compares with SPY, DIA, and IWM
DIA (Dow Jones ETF) compares with SPY, QQQ, and IWM
IWM (Russell 2000 ETF) compares with SPY, QQQ, and DIA
Stock Sector Mapping:
When viewing individual stocks, the indicator automatically identifies the stock's sector and selects appropriate sector ETFs for comparison:
Technology Sector (AAPL, MSFT, GOOGL, NVDA, AMD, INTC, etc.):
Primary: QQQ (Nasdaq 100 ETF)
Secondary: XLK (Technology Select Sector SPDR)
Tertiary: SPY (S&P 500 ETF)
Financial Sector (JPM, BAC, GS, MS, WFC, etc.):
Primary: XLF (Financial Select Sector SPDR)
Secondary: KBE (SPDR S&P Bank ETF)
Tertiary: SPY (S&P 500 ETF)
Energy Sector (XOM, CVX, COP, SLB, etc.):
Primary: XLE (Energy Select Sector SPDR)
Secondary: USO (United States Oil Fund)
Tertiary: SPY (S&P 500 ETF)
Healthcare Sector (JNJ, UNH, PFE, MRK, LLY, etc.):
Primary: XLV (Health Care Select Sector SPDR)
Secondary: IBB (iShares Biotechnology ETF)
Tertiary: SPY (S&P 500 ETF)
Consumer Discretionary Sector (TSLA, HD, NKE, MCD, etc.):
Primary: XLY (Consumer Discretionary Select Sector SPDR)
Secondary: SPY (S&P 500 ETF)
Tertiary: QQQ (Nasdaq 100 ETF)
Consumer Staples Sector (PG, KO, PEP, WMT, COST, etc.):
Primary: XLP (Consumer Staples Select Sector SPDR)
Secondary: SPY (S&P 500 ETF)
Tertiary: QQQ (Nasdaq 100 ETF)
Industrial Sector (CAT, BA, HON, UPS, etc.):
Primary: XLI (Industrial Select Sector SPDR)
Secondary: SPY (S&P 500 ETF)
Tertiary: QQQ (Nasdaq 100 ETF)
Materials Sector (LIN, APD, SHW, FCX, NEM, etc.):
Primary: XLB (Materials Select Sector SPDR)
Secondary: GLD (SPDR Gold Shares)
Tertiary: SPY (S&P 500 ETF)
Utilities Sector (NEE, DUK, SO, etc.):
Primary: XLU (Utilities Select Sector SPDR)
Secondary: SPY (S&P 500 ETF)
Tertiary: QQQ (Nasdaq 100 ETF)
Real Estate Sector (AMT, PLD, CCI, etc.):
Primary: XLRE (Real Estate Select Sector SPDR)
Secondary: VNQ (Vanguard Real Estate ETF)
Tertiary: SPY (S&P 500 ETF)
Communication Services Sector (NFLX, DIS, CMCSA, VZ, T, etc.):
Primary: XLC (Communication Services Select Sector SPDR)
Secondary: SPY (S&P 500 ETF)
Tertiary: QQQ (Nasdaq 100 ETF)
Forex Correlations:
EURUSD compares with GBPUSD
GBPUSD compares with EURUSD
Cryptocurrency Correlations:
BTCUSD compares with ETHUSD
ETHUSD compares with BTCUSD
Three-Symbol Comparison
The indicator supports comparison against up to three symbols simultaneously. When multiple comparison symbols show divergence at the same pivot point, all diverging symbols are displayed in the label, providing stronger confluence. For example, if NQ shows divergence with both ES and YM at the same swing high, the label will display "ES1! + YM1!" indicating divergence confirmation from multiple correlated instruments.
Invalidation Logic
SMT divergences are not indefinitely valid. The indicator includes automatic invalidation logic based on price action following the divergence signal.
Invalidation Rules:
Bearish SMT: Invalidates when price trades above the high of the confirmation pivot (right side of the divergence)
Bullish SMT: Invalidates when price trades below the low of the confirmation pivot (right side of the divergence)
The invalidation level is set at the confirmation bar (the second pivot that completes the SMT pattern), not the extreme of both pivots. This approach aligns with the concept that once price exceeds the confirmation point, the divergence setup is no longer valid.
Invalidation Display Options:
Users can choose to show or hide invalidated SMT signals separately for current timeframe and higher timeframe divergences. When shown, invalidated signals can be displayed with different line styles and widths to visually distinguish them from active signals. Separate limits prevent excessive invalidated signals from cluttering the chart (maximum 15 invalidated signals per timeframe type).
Input Settings
General Settings
Enable SMT Detection:
Master toggle to enable or disable all SMT divergence detection. When disabled, no SMT signals will be calculated or displayed.
Direction:
Filter which divergence types to display:
Both: Display both bullish and bearish SMT divergences
Bullish: Display only bullish SMT divergences (divergence at lows)
Bearish: Display only bearish SMT divergences (divergence at highs)
Symbol Settings
Enable Auto SMT:
When enabled, the indicator automatically selects correlated comparison symbols based on the chart instrument using the correlation mappings described above. When disabled, manual symbol inputs are used.
Symbol 1 (with enable toggle):
First comparison symbol. Enabled by default. When Auto SMT is disabled, enter the desired symbol manually.
Symbol 2 (with enable toggle):
Second comparison symbol. Enabled by default. When Auto SMT is disabled, enter the desired symbol manually.
Symbol 3 (with enable toggle):
Third comparison symbol. Disabled by default. Enable for additional confirmation from a third correlated instrument.
Current Timeframe SMT Settings
Show Current TF SMTs:
Toggle visibility of SMT divergences detected on the chart's current timeframe.
Bullish Color:
Color for bullish SMT divergence lines and labels on the current timeframe.
Bearish Color:
Color for bearish SMT divergence lines and labels on the current timeframe.
Line Style:
Style for current timeframe SMT lines (solid, dashed, or dotted).
Line Width:
Width of current timeframe SMT lines (1-4 pixels).
Show Labels:
Toggle visibility of labels on current timeframe SMT divergences.
Label Style:
Normal: Displays full information including timeframe and diverging symbol names
+/-: Displays minimal "+" or "-" characters with full information available in hover tooltip
Label Size:
Size of current timeframe SMT labels (Tiny, Small, Normal, or Large).
Show Invalidated:
Toggle visibility of invalidated current timeframe SMT signals.
Invalidated Line Style:
Line style for invalidated current timeframe SMT signals.
Invalidated Line Width:
Line width for invalidated current timeframe SMT signals.
Higher Timeframe SMT Settings
Show Higher TF SMTs:
Toggle visibility of SMT divergences detected on the higher timeframe.
Auto Timeframe:
When enabled, automatically selects an appropriate higher timeframe based on the chart's current timeframe. When disabled, uses the manually specified timeframe.
Manual Timeframe:
When Auto Timeframe is disabled, specify the higher timeframe to scan for SMT divergences.
Bullish Color:
Color for bullish SMT divergence lines and labels on the higher timeframe.
Bearish Color:
Color for bearish SMT divergence lines and labels on the higher timeframe.
Line Style:
Style for higher timeframe SMT lines (solid, dashed, or dotted).
Line Width:
Width of higher timeframe SMT lines (1-4 pixels).
Show Labels:
Toggle visibility of labels on higher timeframe SMT divergences.
Label Style:
Normal: Displays full information including timeframe and diverging symbol names
+/-: Displays minimal "+" or "-" characters with full information available in hover tooltip
Label Size:
Size of higher timeframe SMT labels (Tiny, Small, Normal, or Large).
Show Invalidated:
Toggle visibility of invalidated higher timeframe SMT signals.
Invalidated Line Style:
Line style for invalidated higher timeframe SMT signals.
Invalidated Line Width:
Line width for invalidated higher timeframe SMT signals.
Visual Representation
Line Display
SMT divergences are displayed as lines connecting the two pivot points that form the divergence:
For bearish SMT: A line connects the previous swing high to the current (higher) swing high
For bullish SMT: A line connects the previous swing low to the current (lower) swing low
The line color indicates the divergence type (bullish or bearish) and whether it was detected on the current timeframe or higher timeframe.
Label Display
Labels are positioned at the midpoint of the SMT line and display:
The timeframe on which the divergence was detected
The symbol(s) that showed divergence with the chart instrument
When using the "+/-" label style, labels show only "+" for bullish or "-" for bearish divergences, with full information accessible via hover tooltip.
All labels use monospace font formatting for consistent visual appearance.
Combined Signals
When the same divergence is detected on both current and higher timeframes, the signals are combined into a single display using higher timeframe styling. The label shows both timeframes (e.g., "M2 + M15") and all diverging symbols, indicating strong multi-timeframe confluence.
Practical Application Guidelines
Signal Interpretation
SMT divergences should be interpreted within the broader market context. Consider the following when evaluating signals:
Market Structure: SMT divergences occurring at key structural levels (previous highs/lows, order blocks, fair value gaps) tend to be more significant.
Timeframe Confluence: Signals appearing on multiple timeframes simultaneously suggest stronger institutional involvement.
Symbol Confluence: Divergences confirmed by multiple comparison symbols indicate broader market disagreement with the current price direction.
Time of Day: SMT divergences during high-volume trading sessions may carry more weight than those during low-liquidity periods.
Limitations and Considerations
Correlation Variability: Correlations between instruments can strengthen or weaken over time. The automatic symbol selection is based on typical correlations but may not always reflect current market conditions.
Pivot Detection Lag: Pivots are only confirmed after subsequent price action, meaning SMT signals appear with some delay after the actual swing point forms.
False Signals: Not all SMT divergences result in reversals. Use additional confirmation methods and proper risk management.
Data Requirements: The indicator requires sufficient historical data and may not function properly on instruments with limited price history.
Technical Notes
The indicator uses multiple pivot detection periods to identify swing points across different scales
Higher timeframe candle tracking is performed on the lower timeframe chart for precise pivot bar indexing
A deduplication system prevents the same divergence from being detected multiple times across different pivot periods
Array-based storage manages active and invalidated SMT signals with automatic cleanup to prevent memory issues
Maximum label and line counts are set to 500 each to accommodate extended analysis periods
Disclaimer
This indicator is provided for educational and informational purposes only. It is designed to assist traders in identifying potential SMT divergences based on historical price data and should not be considered as financial advice or a recommendation to buy or sell any financial instrument.
Trading financial markets involves substantial risk of loss and is not suitable for all investors. Past performance of any trading methodology, including concepts discussed in this indicator, does not guarantee future results. Users should conduct their own research and analysis before making any trading decisions.
The automatic symbol correlations and sector mappings are based on general market relationships and may not accurately reflect current or future correlations. Users are encouraged to verify correlations independently and adjust comparison symbols as needed.
Always use appropriate risk management techniques, including but not limited to position sizing and stop-loss orders. Never risk more capital than you can afford to lose.

TGIF Dynamic Tracker [NINE]Overview
A professional-grade indicator for tracking weekly price ranges and identifying high-probability retracement zones based on the TGIF (Thank God It's Friday) concept from ICT (Inner Circle Trader) methodology.
What is the TGIF Concept?
The TGIF concept is based on the observation that price tends to retrace a significant portion of the weekly range toward the end of the trading week — typically on Thursday evening or Friday. This phenomenon occurs as institutional traders take profits and rebalance positions before the weekend, creating predictable retracement patterns.
By identifying the weekly high and low, traders can anticipate specific retracement levels where price is likely to find support or resistance. The most commonly referenced retracement zone is the 20-30% level, representing a shallow pullback from the week's extreme before potential continuation.
Features In Depth
Weekly High/Low Tracking
The foundation of the TGIF strategy is accurately tracking the current week's price extremes.
Automatic Detection: The indicator continuously monitors price action and updates the weekly high and low in real-time. As new extremes are made, all dependent calculations (retracement zones, percentage levels) update automatically.
Smart Session Timing: The indicator automatically detects your market type and adjusts accordingly:
Stocks/ETFs: Week begins Monday at 9:30 AM ET (market open)
Forex/Crypto/Futures: Week begins Sunday at 6:00 PM ET (18:00)
This ensures accurate weekly range calculations regardless of which market you're trading.
Visual Customization:
Enable/disable weekly high and low lines independently
Choose line color, style (solid, dashed, dotted), and thickness
Lines extend from week start to current bar
Percentage Level Lines
Individual horizontal lines mark key retracement percentages within the weekly range.
Available Levels:
20% — Shallow retracement, first potential support/resistance
30% — Edge of the primary TGIF zone
50% — Mid-range equilibrium point
60% — Beginning of deeper retracement territory
80% — Deep retracement zone
90% — Near-complete retracement
Independent Controls: Each level can be toggled on or off individually, allowing you to display only the levels relevant to your trading strategy. All levels share common styling settings for a clean, consistent appearance.
Dynamic Bias Adjustment: Levels automatically adjust based on the current weekly bias:
Bullish Bias (new weekly high made): Levels measure DOWN from the high
Bearish Bias (new weekly low made): Levels measure UP from the low
This ensures retracement zones always point toward the direction of potential pullback.
Retracement Zones
Highlighted zones visually emphasize the most significant retracement areas.
Three Configurable Zones:
20-30% Zone (Primary TGIF Zone)
This is the classic TGIF retracement area. When price makes a weekly high or low, traders anticipate a pullback to this zone before potential continuation. This shallow retracement often provides optimal risk/reward entries in the direction of the weekly trend.
50-60% Zone (Equilibrium Zone)
Represents a balanced pullback to the middle of the weekly range. Price reaching this zone suggests a more significant retracement is underway. This area often acts as a decision point — price either finds support/resistance here or continues toward deeper retracement levels.
80-90% Zone (Deep Retracement Zone)
Indicates a near-complete retracement of the weekly range. Price reaching this zone suggests the original weekly move may be fully reversing. Traders watch for reversal signals here or prepare for a potential range expansion in the opposite direction.
Zone Display Options:
Each zone can be enabled/disabled independently
Customizable background colors with transparency control
Zones only appear during the retracement period (starting Thursday/Friday)
Midlines: Optional center lines within each zone (25%, 55%, 85%) provide additional precision points. These midlines often act as the "sweet spot" within each retracement band.
Time-Based Markers
Vertical lines help you identify important session boundaries and timing.
Daily Session Lines:
Mark the start of each trading day with vertical lines extending through the weekly range.
Stocks: 9:30 AM ET (NYSE/NASDAQ open)
Forex/Crypto/Futures: 6:00 PM ET (18:00 — New York session close/new day start)
Control how many historical session lines remain visible (1-5) to avoid chart clutter while maintaining useful reference points.
Weekly Start Lines:
A distinct vertical line marks the beginning of each trading week, providing clear visual separation between weeks and helping you identify the starting point for weekly range calculations.
Retracement Start Lines:
Mark when the TGIF retracement period begins — this is when you should start watching for pullbacks to the retracement zones.
Stocks: Friday 9:30 AM ET (Friday market open)
Forex/Crypto/Futures: Thursday 6:00 PM ET (18:00)
Historical Weeks
View retracement data from previous weeks to identify recurring patterns and validate the TGIF concept on your chosen instrument.
Historical Tracking:
Display up to 20 previous weeks of data
Each historical week shows its own high/low lines, retracement zones, and time markers
Helps identify how consistently the instrument respects TGIF levels
What's Displayed:
Weekly high and low boundaries
All enabled retracement zones with midlines
Weekly start and retracement start lines
Optional labels for historical levels
Historical Labels: Toggle labels on historical weeks independently. Disable them to reduce clutter while keeping the visual reference lines.
Use Cases:
Backtest TGIF setups visually on your chart
Identify instruments that respect TGIF levels consistently
Study how deep retracements typically go on your chosen market
Labels & Display Modes
Comprehensive labeling options for quick reference.
Label Display Modes:
Levels: Shows only the level name (e.g., "HIGH", "20%", "50%")
Price: Shows only the price value
Both: Shows level name and price (e.g., "20% | 1.2345")
Label Positioning: Labels appear to the right of the current bar, staying visible as price action develops.
Tooltips: When using "Levels" display mode, hover over any label to see the exact price in the tooltip.
Label Customization:
Text size: Tiny, Small, Normal, Large, Huge
Text color selection
Labels use monospace font for clean alignment
Info Table
An optional real-time summary table showing all current levels and their distance from price.
Table Contents:
Current day indicator (MON, TUE, WED, THU, FRI)
All six percentage levels (20%, 30%, 50%, 60%, 80%, 90%)
Exact price for each level
Distance from current price to each level
Adaptive Theming: The table automatically detects your chart's background color (light or dark) and adjusts text and border colors for optimal readability.
Display Settings:
9 position options (corners, edges, and center)
Size options: Tiny, Small, Normal, Large
Practical Use: Quickly identify which level is nearest to current price without visually scanning the chart. The distance column helps assess how far price needs to travel to reach key zones.
Smart Market Detection
The indicator automatically identifies your market type and adjusts all timing calculations.
Detected Market Types:
Stocks & ETFs:
Week starts: Monday 9:30 AM ET
Daily sessions: 9:30 AM ET
Retracement period begins: Friday 9:30 AM ET
Standard equity market hours apply
Forex & Crypto:
Week starts: Sunday 6:00 PM ET (18:00)
Daily sessions: 6:00 PM ET (18:00)
Retracement period begins: Thursday 6:00 PM ET (18:00)
24-hour market timing with New York session rollover
Futures Contracts:
Automatically detected via common futures symbols (ES, NQ, YM, RTY, CL, GC, etc.)
Uses forex-style timing (18:00 ET rollover)
Handles continuous contracts and front-month symbols
This automatic detection ensures you get accurate weekly ranges without manual configuration.
Bias Tracking
The indicator dynamically tracks weekly directional bias to orient retracement calculations correctly.
How Bias is Determined:
When price makes a new weekly high, bias shifts to BULLISH
When price makes a new weekly low, bias shifts to BEARISH
Bias can change multiple times throughout the week as new extremes are made
Why Bias Matters:
Retracement levels are calculated from the appropriate extreme based on current bias:
Bullish bias: Levels measure DOWN from the weekly high (anticipating pullback from high)
Bearish bias: Levels measure UP from the weekly low (anticipating pullback from low)
This ensures the 20-30% zone always represents a shallow retracement in the context of the current weekly direction.
Tips
Best Results on Trending Weeks: TGIF works best when there's a clear weekly direction. Choppy, range-bound weeks may not produce clean retracements.
Combine with Other Confluence: TGIF levels are most powerful when they align with other technical factors — Fair Value Gaps, order blocks, previous week highs/lows, or key support/resistance levels.
Use Historical Data: Enable historical weeks to see how your instrument typically respects TGIF levels. Some instruments are more "TGIF-friendly" than others.
Midlines as Precision Points: The midlines (25%, 55%, 85%) often act as the exact reversal point within each zone. Watch for reactions specifically at these levels.
Friday Afternoon Caution: Late Friday sessions can be thin and choppy. Consider taking profits or reducing position sizes heading into the weekend.
Requirements
Intraday Timeframes Only: This indicator requires timeframes of 1 hour or less for accurate session and weekly boundary detection.
Sufficient Historical Data: When using the Historical Weeks feature, ensure your chart has enough bars loaded to display the requested number of weeks.
Session-Based Markets: Optimized for markets with distinct sessions. Continuous 24/7 markets may show different characteristics.
Disclaimer
For Educational and Informational Purposes Only
This indicator is provided as a technical analysis tool for educational and informational purposes only. It is not intended as, and should not be construed as, financial advice, investment advice, trading advice, or any other type of advice.
No Guarantees: Past performance of any trading strategy, indicator, or methodology is not indicative of future results. The TGIF concept and associated retracement levels do not guarantee that price will behave in any predicted manner. Markets are inherently
unpredictable, and no technical indicator can accurately predict future price movements.
Risk Warning: Trading financial instruments involves substantial risk of loss and is not suitable for all investors. You should carefully consider your investment objectives, level of experience, and risk appetite before trading. Never trade with money you cannot afford to lose.
Not Financial Advice: The creator of this indicator (NINE) is not a licensed financial advisor, broker, or dealer. Nothing in this indicator or its documentation should be interpreted as a recommendation to buy, sell, or hold any financial instrument.
Your Responsibility: You are solely responsible for your own trading decisions. Always conduct your own research and due diligence before making any trading or investment decisions. Consider consulting with a qualified financial professional before trading.
No Liability: The creator assumes no responsibility or liability for any errors, inaccuracies, or omissions in this indicator or its documentation. The creator shall not be held liable for any losses, damages, or costs arising from the use or inability to use this indicator.

NWOG/NDOG [NINE]Overview
A professional-grade indicator for detecting and visualizing New Week Opening Gaps (NWOGs) and New Day Opening Gaps (NDOGs), essential concepts in ICT (Inner Circle Trader) methodology and analysis.
What Are Opening Gaps?
Opening gaps represent price inefficiencies created between trading sessions. When one session closes and the next session opens at a different price, the resulting "gap" creates a zone of unfilled orders and potential liquidity. These gaps often act as magnets for price, providing high-probability trading opportunities as the market seeks to rebalance these inefficiencies.
NWOG (New Week Opening Gap)
The gap between Friday's close and Sunday's open. These weekly imbalances are significant because they represent the collective repositioning of institutional traders over the weekend. NWOGs frequently serve as major support/resistance zones that can influence price action for days or even weeks. Due to their larger timeframe context, NWOGs typically carry more weight than daily gaps.
NDOG (New Day Opening Gap)
The gap between one session's close and the next session's open. Daily gaps occur more frequently than weekly gaps, offering more regular trading setups. While individually less significant than NWOGs, NDOGs provide valuable intraday reference points and often fill within the same trading session.
Features In Depth
Gap Detection & Visualization
The indicator automatically identifies and plots opening gaps as they form in real-time.
Automatic Detection: The indicator monitors session transitions and instantly identifies when a gap forms between the previous close and current open. NWOGs are detected on Sunday opens, while NDOGs are detected at each new daily session open (excluding Sundays, which are reserved for NWOG detection).
Bullish vs Bearish Classification: Each gap is automatically classified based on its direction:
Bullish Gap (Gap Up): Current open is higher than previous close, indicates overnight buying pressure
Bearish Gap (Gap Down): Current open is lower than previous close, indicates overnight selling pressure
The indicator uses distinct color schemes for bullish and bearish gaps, making it easy to identify gap direction at a glance. Current/most recent gaps use the "new" color settings, while historical gaps use the standard color settings.
Historical Tracking: Track up to 20 gaps of each type simultaneously. The "Historical Count" setting controls how many gaps remain visible on your chart. Older gaps are automatically removed as new ones form, keeping your chart clean while maintaining relevant historical context.
Visual Customization:
Toggle gap boundary lines (HIGH/LOW) on or off independently from the background fill
Choose line styles: solid (⎯⎯⎯), dashed (----), or dotted (····)
Adjust line thickness from 1-4 pixels
Enable/disable background fill with customizable transparency
Set colors independently for current vs historical gaps
Consequent Encroachment (C.E.)
The Consequent Encroachment represents the 50% midpoint of a gap — a critical level in ICT methodology.
Why C.E. Matters: In smart money concepts, the C.E. level represents the point of maximum efficiency within an imbalance. Price often gravitates toward this level as it seeks to rebalance the gap. Many traders use C.E. as their primary target when trading gap fills, or as a key level for entries and stop placement.
C.E. Display Options:
Independent color settings for current vs historical gaps
Separate line style and thickness controls
Can be shown/hidden independently from gap boundaries
Quarter Levels (25% and 75%): For traders who want additional precision, the indicator offers optional quarter levels at 25% and 75% of the gap range. These levels can serve as:
Partial profit targets
Scaling entry points
Additional support/resistance zones within the gap
Fill Tracking & Percentage
The indicator provides sophisticated fill tracking to monitor how much of each gap has been "filled" by subsequent price action.
How Fill Percentage Works:
For bullish gaps (gap up): Measures how far price has retraced DOWN from the gap's high toward its low
For bearish gaps (gap down): Measures how far price has retraced UP from the gap's low toward its high
The fill percentage updates in real-time as price moves through the gap zone, giving you instant feedback on gap fill progress.
Fill Detection Methods:
Wicks: Uses the full candle range (high/low) — more sensitive, detects fills earlier
Bodies: Uses only open/close prices — more conservative, requires stronger commitment
Visual Fill Indicators: The fill percentage is displayed with intuitive symbols:
〇 0-24% filled — Gap is largely untouched
◔ 25-49% filled — Minor fill in progress
◑ 50-74% filled — C.E. level has been reached
◕ 75-99% filled — Gap nearly complete
⬤ 100% filled — Gap fully filled
Hide Filled Gaps: Enable this option to automatically remove gaps from your chart once they reach 100% fill. This keeps your chart focused on active, unfilled gaps that still represent potential trading opportunities.
Projection Levels
When price breaks out of a gap zone, projection levels provide potential targets based on the gap's size.
How Projections Work: Once price closes above a gap's high (for upward projections) or below a gap's low (for downward projections), the indicator calculates extension levels using the gap's range as a measuring unit. These projections function similarly to Fibonacci extensions but are anchored to the gap's dimensions.
Projection Direction:
Upward Projections: Triggered when price closes above the gap's high — levels project above the gap
Downward Projections: Triggered when price closes below the gap's low — levels project below the gap
Customizable Multipliers: Define your own projection levels using the "Projection Levels" input. Enter comma-separated values representing multiples of the gap size:
Default: 0.5,1,2,2.5
Example custom: 0.618,1,1.618,2,2.618 (Fibonacci-based)
Each value creates a projection line at that multiple of the gap range
Projection Display Options:
Side: Display projections on the Left (extending back from gap formation) or Right (extending forward)
Color, Style, Thickness: Full visual customization
Labels: Show multiplier values at each projection level
"Extend Until Tapped" Feature: When enabled (Left side only), projection lines stop extending once price touches them. This creates a visual record of which levels have been reached and when, helping you track projection performance over time. Untapped projections continue extending until they're reached.
Labels & Formatting
Comprehensive labeling options help you quickly identify and reference gaps on your chart.
Label Format Options:
Gap Type: Simple label showing "NWOG" or "NDOG"
Gap Type + Date: Includes the full date with day of week (e.g., "NWOG Monday, November 3, 2025")
Gap Type + Date + Filled Percent: Adds the fill percentage and symbol (e.g., "NWOG Monday, November 3, 2025 ")
Label Positioning:
When Show Levels is ON: Separate labels appear at the HIGH and LOW boundaries
When Show Levels is OFF: A single label appears at the C.E. (midpoint) level
Label Customization:
Text size: Tiny, Small, Normal, or Large
Text color and background color (set background transparency to 100 for no background)
Tooltips provide detailed information including all price levels and fill percentage
Hide Historical Labels: Enable this option to hide labels and projection text on all gaps except the most recent. Lines remain visible, but text clutter is reduced — useful when tracking many historical gaps.
Status Table
An optional summary table provides at-a-glance information about all active gaps.
Table Contents: For each active gap, the table displays:
Gap Type: NWOG or NDOG with date
HIGH: Upper boundary of the gap
LOW: Lower boundary of the gap
C.E.: Consequent Encroachment (50% level)
% Filled: Current fill percentage with visual symbol
Display Settings:
Position: 9 positions available (Top/Middle/Bottom × Left/Center/Right)
Size: Tiny, Small, or Normal text
Gap Count: Control how many NWOGs and NDOGs appear in the table (1-3 each)
Adaptive Theming: The table automatically detects your chart's background color and adjusts text colors for optimal readability on both light and dark themes.
Smart Filtering: The table only shows unfilled gaps (or gaps not hidden by the "Hide Filled" setting), keeping the display focused on actionable information.
Alert System
Stay informed of key gap events without constantly monitoring your charts.
Gap Formation Alerts: Receive an alert the moment a new gap is detected. The alert includes:
Gap direction (Bullish/Bearish)
Gap type (NWOG/NDOG)
Symbol name
Example: "Bullish NWOG formed on AMEX:SPY "
Gap Filled Alerts: Get notified when a gap reaches 100% fill. This is valuable for:
Confirming trade targets have been reached
Identifying when gaps are no longer active reference points
Example: "NWOG filled on AMEX:SPY "
Projection Level Alerts: Receive alerts when price reaches your defined projection levels. Each level only alerts once, preventing spam. Useful for:
Taking profits at projection targets
Identifying extended moves beyond the gap
Example: "NWOG 2x projection reached on AMEX:SPY "
General Settings
Gap Offset: Controls how many bars the gap lines extend to the right of the current candle (0-15 bars). A higher offset keeps labels and lines visible further into the future, while a lower offset keeps the display tighter to current price action.
Tips
NWOG Priority: NWOGs typically hold more significance than NDOGs due to their weekly timeframe. When NWOG and NDOG levels conflict, consider giving more weight to the NWOG.
Unfilled Historical Gaps: Gaps from days or weeks ago can still influence current price action. Don't ignore older unfilled gaps — they often become relevant when price returns to those zones.
Session Context: Pay attention to which session created the gap. Gaps formed during high-volume sessions (like NYSE open) may carry more significance than gaps from lower-volume periods.
Gap Size Matters: Larger gaps represent more significant imbalances and often provide stronger support/resistance. Smaller gaps may fill quickly and offer less reliable levels.
Clean Chart Option: Use "Hide Historical Labels" combined with the status table to maintain a clean chart while still having access to all gap information.
Requirements
Intraday Timeframes Only: This indicator works exclusively on intraday timeframes (minutes, hours). Gap detection requires session open/close data that is only available on intraday charts.
Sufficient Historical Data: Ensure your chart has enough historical bars loaded for accurate gap tracking, especially if using higher historical count settings.
Session-Based Markets: The indicator is optimized for markets with distinct trading sessions (stocks, futures, forex). 24/7 markets like crypto may show fewer or different gap patterns.
Disclaimer
For Educational and Informational Purposes Only
This indicator is provided as a technical analysis tool for educational and informational purposes only. It is not intended as, and should not be construed as, financial advice, investment advice, trading advice, or any other type of advice.
No Guarantees: Past performance of any trading strategy, indicator, or methodology is not indicative of future results. The identification of gaps, projections, and fill levels does not guarantee that price will behave in any predicted manner. Markets are inherently unpredictable, and no technical indicator can accurately predict future price movements.
Risk Warning: Trading financial instruments involves substantial risk of loss and is not suitable for all investors. You should carefully consider your investment objectives, level of experience, and risk appetite before trading. Never trade with money you cannot afford to lose.
Not Financial Advice: The creator of this indicator (NINE) is not a licensed financial advisor, broker, or dealer. Nothing in this indicator or its documentation should be interpreted as a recommendation to buy, sell, or hold any financial instrument.
Your Responsibility: You are solely responsible for your own trading decisions. Always conduct your own research and due diligence before making any trading or investment decisions. Consider consulting with a qualified financial professional before trading.
No Liability: The creator assumes no responsibility or liability for any errors, inaccuracies, or omissions in this indicator or its documentation. The creator shall not be held liable for any losses, damages, or costs arising from the use or inability to use this indicator.

HTF LiquidityThe ICT Liquidity Sweeps Indicator is designed to track liquidity zones in the market areas where stop-losses and pending orders are typically clustered. This indicator marks buyside liquidity (resistance) and sellside liquidity (support) from HTF (H4, H1 and M15), helping traders identify areas where price is likely to manipulate liquidity before making a significant move.
This tool is based on Inner Circle Trader (ICT) Smart Money Concepts, which emphasize how institutional traders, or “Smart Money,” manipulate liquidity to fuel price movements. By identifying these zones, traders can anticipate liquidity sweeps and position themselves accordingly.
⚙️ How It Works
1️⃣ Detects Key Liquidity Zones
The script automatically identifies significant swing highs and swing lows in price action using a pivot-based method.
A swing high (buyside liquidity) is a peak where price struggles to break higher, forming a resistance level.
A swing low (sellside liquidity) is a valley where price struggles to go lower, creating a support level.
These liquidity points are prime targets for liquidity sweeps before a true trend direction is confirmed.
2️⃣ Draws Liquidity Lines
Once a swing high or low is identified, a horizontal line is drawn at that level.
The lines extend to the right, serving as future liquidity targets until they are broken.
The indicator allows customization in terms of color, line width, and maximum number of liquidity lines displayed at once.
3️⃣ Handles Liquidity Sweeps
When price breaks a liquidity level, the indicator reacts based on the chosen action setting:
Dotted/Dashed: The line remains visible but changes style to indicate a sweep.
Delete: The line is completely removed once price has interacted with it.
This feature ensures that traders can easily spot where liquidity has been taken and determine whether a reversal or continuation is likely.
4️⃣ Prevents Chart Clutter
To maintain a clean chart, the script limits the number of liquidity lines displayed at any given time.
When new liquidity zones are formed, the oldest lines are automatically removed, keeping the focus on the most relevant liquidity zones.

OHLC ProjectionsOHLC Projections is an advanced analytical tool designed to forecast potential price ranges for the current session (Daily or Weekly) based on historical data. The indicator utilizes a statistical analysis of price behavior relative to the Open, calculating average values for "Manipulation" (movement against the closing direction) and "Distribution" (the main expansion in the closing direction).
Unlike standard moving averages, this tool creates a "roadmap" for the developing candle, helping traders identify potential session highs and lows before they form.
How It Works
The algorithm analyzes a user-defined lookback period (e.g., 60 candles) and calculates:
Manipulation (M): The average length of the wick formed opposite to the candle's closing direction (e.g., the bottom wick of a bullish candle).
Distribution (D): The average distance from the Open to the extreme point in the direction of the close.
Based on these metrics, the following levels are projected:
Open Line: The opening price of the period (Always Solid).
Manipulation Levels (+M / -M): The statistical range where price often "traps" traders before the true move begins. These are often ideal reversal points (Smart Money Reversal).
Distribution Levels (+D / -D): The statistical target (Take Profit) that price tends to reach after the manipulation phase is complete.
Key Features
Anchored Levels (Non-Repainting): Levels are calculated once at the start of a new session (e.g., at Midnight) and remain fixed throughout the day. They do not "float" or repaint with current price action.
History Management: A unique "Limit history to current day" feature keeps your chart clean. When enabled, the indicator automatically removes lines from previous days, leaving only the projections relevant to the current active session.
NY Midnight Support: Option to anchor daily calculations specifically to the New York Midnight Open (essential for ICT/SMC traders).
Dual Timeframe: Ability to display projections for two timeframes simultaneously (e.g., Daily and Weekly) on lower timeframe charts.
"Areas" Mode: Option to display zones (Boxes) instead of lines, based on two different lookback periods (short and long), allowing for the visualization of statistical confluence.
Premium/Discount Zones: Optional shading of zones above and below the opening price to easily identify expensive (Premium) and cheap (Discount) price areas.
Configuration & Visuals
The indicator is fully customizable:
Lookback Period: Adjust the number of historical candles used for the average calculation.
Visual Style: Full control over line colors and styles. The Open Line is always forced to Solid for easy distinction, while other levels can be set to dotted or dashed.
Statistics Table: An optional dashboard displaying the specific price values for all calculated levels.
Strategy Application
This tool is highly effective for Smart Money Concepts (SMC) and Inner Circle Trader (ICT) strategies.
Look for Short opportunities when price extends above the Open and hits the -M or +D levels.
Look for Long opportunities when price drops below the Open and tests the +M or -D levels.
Alerts
Built-in alerts allow you to be notified immediately when price crosses key Manipulation or Distribution levels, ensuring you never miss a reaction point.

FVG & IFVG MTF Detector [Alphaomega18]TITLE:
FVG & IFVG Multi-Timeframe Detector
SHORT DESCRIPTION:
Automatic Fair Value Gap (FVG) and Inverse Fair Value Gap (IFVG) detector with multi-timeframe analysis and automatic gap fill closure.
FULL DESCRIPTION:
📊 OVERVIEW
This indicator automatically detects Fair Value Gaps (FVG) and Inverse Fair Value Gaps (IFVG) on your current timeframe and up to 12 additional timeframes simultaneously. Perfect for confluence analysis and identifying institutional zones.
🎯 KEY FEATURES
✅ Multi-Timeframe Detection:
• 12 available timeframes: 1min, 2min, 5min, 10min, 15min, 30min, 1H, 2H, 4H, Daily, Weekly, Monthly
• Each timeframe with customizable color
• Timeframe labels positioned on the right of boxes
✅ Automatic Closure:
• FVGs automatically close when price fills the gap
• Option to disable for traditional fixed extension
• Smart midline management
✅ Complete Customization:
• Customizable colors for each timeframe
• Configurable label size, position, and style
• Gap size display options (separate for current TF and MTF)
• Transparent or colored labels for MTF
• Customizable borders and midlines
✅ Filters & Controls:
• Filter by minimum gap size
• Maximum boxes per timeframe
• Configurable box extension (5-100 bars)
• Border styles: Solid, Dashed, Dotted
✅ Integrated Dashboard:
• Active FVG/IFVG counter
• Statistics per timeframe
• Customizable position
📈 USAGE
1. **Timeframe Activation**:
- Go to Settings > Multi-Timeframe
- Check the timeframes you want to analyze
- Customize colors for each timeframe
2. **Display Configuration**:
- Settings > Display: control labels and their content
- "Transparent MTF Labels": displays only timeframe text without colored background
- "Show Gap Size": separate options for current TF and MTF
3. **Automatic Closure**:
- Settings > Filters > "Close FVG when Filled": enable to automatically close filled gaps
- Disable for traditional fixed extension
4. **Filtering**:
- "Min Gap Size": filter out insignificant small gaps
- "Max Boxes": control the number of FVGs displayed per timeframe
🔍 INTERPRETATION
• **Bullish FVG (🟢)**: Bullish gap - potential support zone
• **Bearish IFVG (🔴)**: Bearish gap - potential resistance zone
• **MTF Confluences**: Multiple FVGs from different timeframes at the same level = strong institutional zone
⚙️ TECHNICAL PARAMETERS
• Detection: low > high (bullish) | high < low (bearish)
• Max boxes per timeframe: 500
• Max lines: 500
• Automatic memory management (old FVG deletion)
🎨 ADVANCED CUSTOMIZATION
• Separate background and border colors
• 4 label sizes: Tiny, Small, Normal, Large
• 3 label positions for current TF: Left, Center, Right
• MTF labels always positioned right for clarity
• Optional midlines with customizable style and color
💡 USAGE TIPS
1. Start with 2-3 timeframes maximum to avoid visual overload
2. Use contrasting colors to easily differentiate timeframes
3. Daily/Weekly gaps are perfect for identifying major institutional zones
4. Combine with your price action strategy for precise entries
5. Automatic closure helps identify when a zone is invalidated
📊 IDEAL FOR
• ICT Traders (Inner Circle Trader)
• Scalping & Day Trading
• Swing Trading
• Institutional zone analysis
• Multi-timeframe confluence trading
🔔 ALERTS
Configurable alerts for:
• New Bullish FVG detected
• New Bearish IFVG detected
---
© 2024 Alphaomega18 - All rights reserved
License: Mozilla Public License 2.0

SIFVG [ULTRA+]Introduction
Sweep Inverse Fair Value Gap° is a fully customizable charting tool built to track inversion fair value gap logic that occur after displacement events—specifically when Fair Value Gaps (FVGs) are closed through, and effectively flipping their original state. The tool is inspired by Inner Circle Trader (ICT) concepts, offering a clean visual interface to support traders studying price behaviour after liquidity sweeps, FVG closures, and highlighting mechanical swings targets.
This indicator does not draw zones or suggest direction. It operates entirely on confirmed price events and produces logic-bound visuals designed for traders who already understand IFVG-based reasoning and seek visual consistency across sessions, Timeframe on any instrument.
Key Terms and Definitions
• Swing High / Swing Low: A swing high is a local price peak with lower highs on either side. A swing low is a local trough with higher lows on either side. These are used to detect where liquidity may rest and are required for confirming the initial raid condition in the IFVG model.
• Liquidity Raid: This occurs when price trades through a prior swing high or low, effectively “sweeping” a level where orders may be clustered around. The raid is a required precursor to inversion logic in this model. The tool will not evaluate a potential Fair Value Gap or Inversion Fair Value Gap unless a swing high or low has been taken first.
• Fair Value Gap (FVG): A Fair Value Gap is a price imbalance that occurs when a strong move leaves a gap between candles—specifically, when the high of one candle and the low of a later candle do not overlap. FVGs often emerge during displacement and are commonly studied as inefficiencies within a price leg.
• Inversion Fair Value Gap: An inversion happens when price fully closes through an existing Fair Value Gap that raided liquidity, suggesting the original imbalance rebalanced, and looks to reverse its original role. For example, when a bearish FVG is closed above after raiding a swing low, it may present a shift in orderflow (bullish inversion). The tool recognizes SIFVGs as “inverted” after a candle body candle closes through the gap post raid.
• Displacement: A strong directional price move, typically with momentum, that leaves a Fair Value Gap behind. Displacement is important in inversion logic, as it creates the context and confidence in comparing and contrasting FVGs and Inversions for obvious flips in market behaviour.
• SIFVG Line: Once inversion occurs, the indicator draws a single horizontal array on the candle's close. It marks the start of model activation. This is not a prediction level or a support/resistance area, as it merely serves as a reference for when model logic is sequentially active.
• Opposing Swing: The swing high or low opposite the one that was swept during the initial raid. This becomes the model’s first target for mechanical delivery and is automatically drawn once the IFVG line is plotted. When price reaches this swing, the model has reached its mechanical objective and could offer opportunities for further continuation to additional liquidity pools if orderflow continues to be present.
• Invalidation: The Sweep Inversion Fair Value Gap is considered invalid in one of two scenarios, which the user can toggle individually: a body print back above/below the inversion in bearish/bullish conditions, or trading above/below the most recent swing high/low after the liquidity raid. The SIFVG line will continue extending until the setup is invalidated by the chosen toggle, or when the Opposing Swing is reached.
• Consequent Encroachment (CE): The midpoint (50%) of the FVG or SIFVG. This line can be optionally displayed for users who use the midpoint of imbalances for reference of imbalance respect. It is not required by the model’s internal logic but may assist with discretionary interpretation.
• Description
At its core, SIFVG follows a structured three-step logic sequence: a FVG is created, liquidity is taken, and the Fair Value Gap (FVG) inside of the leg of the raid is closed through, signally a potential orderflow shift. Once inversion is confirmed, an SIFVG line is plotted at the close of the candle that caused the inversion, making it the structural anchor for the model.
The tool does not account for partial fills or candle wicks for FVGs or SIFVGs. Only full-body closures through a qualifying FVG are recognized. When this occurs, a bullish or bearish inversion is plotted and the model becomes active. From there, the opposing swing (the unswept high or low from the displacement leg) is automatically drawn as the target for the model.
Key Features
The Bias allows traders to define whether to track bullish inversions (closing above bearish FVGs), bearish inversions (closing below bullish FVGs), or neutral to see both. This allows isolated directional focus as well as the ability to display all models.
The Session Filter enables traders to define up to four specific Time blocks when the model is permitted to trigger. The Macros Only toggle filters setups further by limiting activation to the first and last 10 minutes of each hour, a filter inspired for intraday traders and scalpers.
How Traders Can Use the Indicator Effectively
SIFVG is not meant to identify trade signals, entries, or exits. It is best used as a visual tracker and confluence for structure-based delivery. The tool excels as a companion for:
Journaling and reviewing SIFVG-based setups across Timeframes and sessions
Studying structural completion or invalidation behaviour
Tracking delayed deliveries and retracement-based logic
Traders using the tool should be familiar with FVG formations, inversion criterias, and the importance of orderflow once an opposing swing is reached.
Usage Guidance
Add the SIFVG to a TradingView chart. This is a fractal script and can be applied across any Timeframe or asset pairing.
Use the SIFVG line to track inversion structure, monitor when inversions are created and negated, and reference the opposing swing to determine whether structural delivery has completed.
Use the SIFVG in combination with your own discretion and narrative to assess when the model has flipped, held, or broken.
Terms and Conditions
Our charting tools are products provided for informational and educational purposes only and do not constitute financial, investment, or trading advice. Our charting tools are not designed to predict market movements or provide specific recommendations. Users should be aware that past performance is not indicative of future results and should not be relied upon for making financial decisions. By using our charting tools, the purchaser agrees that the seller and the creator are not responsible for any decisions made based on the information provided by these charting tools. The purchaser assumes full responsibility and liability for any actions taken and the consequences thereof, including any loss of money or investments that may occur as a result of using these products. Hence, by purchasing these charting tools, the customer accepts and acknowledges that the seller and the creator are not liable nor responsible for any unwanted outcome that arises from the development, the sale, or the use of these products. Finally, the purchaser indemnifies the seller from any and all liability. If the purchaser was invited through the Friends and Family Program, they acknowledge that the provided discount code only applies to the first initial purchase of any Marcus product. The purchaser is therefore responsible for cancelling – or requesting to cancel – their subscription in the event that they do not wish to continue using the product at full retail price. If the purchaser no longer wishes to use the products, they must unsubscribe from the membership service, if applicable. We hold no reimbursement, refund, or chargeback policy. Once these Terms and Conditions are accepted by the Customer, before purchase, no reimbursements, refunds or chargebacks will be provided under any circumstances.
By continuing to use these charting tools, the user acknowledges and agrees to the Terms and Conditions outlined in this legal disclaimer.

ATR/ADR MTF Projection ArrayATR/ADR MTF Projection Array
Overview
A powerful predictive tool that projects ATR (Average True Range) and ADR (Average Daily Range) levels as clean support and resistance arrays on your chart. Designed for traders who want to anticipate the high and low of the day using volatility-based projections with multi-timeframe confluence.
This indicator combines traditional ATR analysis with ICT-style ADR methodology, giving you institutional-grade level projections from a single, customizable tool.
Key Features
🎯 Dual Volatility Metrics
ATR Projections — Classic volatility-based levels with full multi-timeframe support
ADR Projections (ICT Style) — Average Daily Range levels using Inner Circle Trader methodology
Enable/disable each independently based on your trading preference
📊 Multi-Timeframe ATR Analysis
Plot ATR levels from up to 3 timeframes simultaneously (Daily, Weekly, Monthly or custom)
Each timeframe displays with distinct styling for easy identification
Perfect for confluence trading across multiple time horizons
⚡ ICT ADR Methodology
NY Midnight calculation mode (ICT standard) or Classic Daily
Key ICT levels built-in:
1/3 ADR (Judas Swing) — Critical manipulation level where fake moves often terminate
1/2 ADR — Mid-range reference
2/3 ADR — Trending day continuation target
100% ADR — Full daily range completion
150% ADR — Extension target for expansion days
Two projection modes: Static (from anchor) or Dynamic (from session high/low)
🔧 Flexible Anchor Points
Previous Close (default)
Daily Open
Weekly Open
Monthly Open
Session Open
📈 Range Completion Tracking
Real-time display of how much of the expected daily range has been consumed
Visual status indicator helps identify when the day's move may be exhausted
How To Use
For Bias Confirmation:
Establish your directional bias using your preferred method (trigger day, market structure, etc.)
Monitor the 1/3 ADR level during London/NY open for potential Judas Swing (manipulation move)
Target 2/3 to 100% ADR for your HOD/LOD objective
For Target Setting:
Use ATR levels as volatility-based profit targets
ADR 100% level often marks session extremes
When Range Used reaches 100%+, expect consolidation or reversal
For Multi-Timeframe Confluence:
Enable Weekly/Monthly ATR levels alongside Daily
Look for clustering of levels across timeframes for high-probability zones
Settings Guide
Master Controls — Toggle ATR/ADR systems and bull/bear levels independently
ATR Settings — Configure period, multiplier, anchor point, and select which timeframes to display
ATR Level Multipliers — Choose which projection levels to show (0.5x, 0.75x, 1.0x, 1.25x, 1.5x)
ADR Settings (ICT Style) — Select calculation mode (NY Midnight recommended), period (5 days is ICT standard), and projection mode
ADR Level Selection — Toggle individual ICT levels (1/3, 1/2, 2/3, 100%, 150%)
Visual Settings — Customize colors, line styles, labels, and info table position
Alerts Included
ATR 1.0x Bull/Bear Cross
ADR 1/3 Judas Swing Zone (Bull/Bear)
ADR 100% Range Completion (Bull/Bear)

TMT ICT SMC - Hitesh NimjeTMT ICT SMC - Smart Money Concepts
Overview
T
he TMT ICT SMC indicator is a comprehensive, all-in-one toolkit designed for traders utilizing Smart Money Concepts (SMC) and Inner Circle Trader (ICT) methodologies. Developed by Hitesh Nimje (Thought Magic Trading), this script automates the complex task of market structure mapping, order block identification, and liquidity analysis, providing a clear, institutional-grade view of price action.
Whether you are a scalper looking for internal structure shifts or a swing trader analyzing major trend reversals, this tool adapts to your timeframe with precision.
Key Features
1. Market Structure Mapping (Internal & Swing)
* Real-Time Structure: Automatically detects and labels BOS (Break of Structure) and CHoCH (Change of Character).
* Dual-Layer Analysis:
I nternal Structure: Captures short-term momentum and minor shifts for entry refinement.
Swing Structure: Identifies the overarching trend and major pivot points.
* Strong vs. Weak Highs/Lows: visualizes significant swing points to help you identify safe invalidation levels.
* Trend Coloring: Optional feature to color candles based on the active market structure trend.
2. Advanced Order Blocks (OB)
* Auto-Detection: Plots both Internal and Swing Order Blocks automatically.
* Smart Filtering: Includes an ATR or Cumulative Mean Range filter to remove noise and only display significant institutional footprint zones.
* Mitigation Tracking: Choose how order blocks are mitigated (Close vs. High/Low) to keep your chart clean.
3. Liquidity & Gaps
* Fair Value Gaps (FVG): Automatically highlights bullish and bearish imbalances. Includes MTF (Multi-Timeframe) capabilities to see higher timeframe gaps on lower timeframe charts.
* Equal Highs/Lows (EQH/EQL): Marks potential liquidity pools where price often reverses or targets.
4. Multi-Timeframe Levels
* Plots Daily, Weekly, and Monthly High/Low levels directly on your chart to help identify macro support and resistance without switching timeframes.
5. Premium & Discount Zones
* Automatically plots the Fibonacci range of the current price leg to show Premium (expensive), Discount (cheap), and Equilibrium zones, aiding in high-probability entry placement.
Customization
* Style: Switch between a "Colored" vibrant theme or a "Monochrome" minimal theme.
* Control: Every feature can be toggled on/off. Adjust lookback periods, sensitivity thresholds, and colors to match your personal trading style.
* Modes: Choose between "Historical" (for backtesting) and "Present" (for optimized real-time performance).
How to Use
* Trend Confirmation: Use the Swing Structure labels to determine the higher timeframe bias.
* Entry Trigger: Wait for a CHoCH on the Internal Structure within a higher timeframe Order Block or FVG.
* Targeting: Use the Equal Highs/Lows (Liquidity) or opposing Order Blocks as take-profit zones.
Credits
* Author: Hitesh Nimje
* Source: Thought Magic Trading (TMT)
TRADING DISCLAIMER
RISK WARNING
Trading involves substantial risk of loss and is not suitable for all investors. Past performance is not indicative of future results. You should carefully consider whether trading is suitable for you in light of your circumstances, knowledge, and financial resources.
NO FINANCIAL ADVICE
This indicator is provided for educational and informational purposes only. It does not constitute:
* Financial advice or investment recommendations
* Buy/sell signals or trading signals
* Professional investment advice
* Legal, tax, or accounting guidance
LIMITATIONS AND DISCLAIMERS
Technical Analysis Limitations
* Pivot points are mathematical calculations based on historical price data
* No guarantee of accuracy of price levels or calculations
* Markets can and do behave irrationally for extended periods
* Past performance does not guarantee future results
* Technical analysis should be used in conjunction with fundamental analysis
Data and Calculation Disclaimers
* Calculations are based on available price data at the time of calculation
* Data quality and availability may affect accuracy
* Pivot levels may differ when calculated on different timeframes
* Gaps and irregular market conditions may cause level failures
* Extended hours trading may affect intraday pivot calculations
Market Risks
* Extreme market volatility can invalidate all technical levels
* News events, economic announcements, and market manipulation can cause gaps
* Liquidity issues may prevent execution at calculated levels
* Currency fluctuations, inflation, and interest rate changes affect all levels
* Black swan events and market crashes cannot be predicted by technical analysis
USER RESPONSIBILITIES
Due Diligence
* You are solely responsible for your trading decisions
* Conduct your own research before using this indicator
* Verify calculations with multiple sources before trading
* Consider multiple timeframes and confirm levels with other technical tools
* Never rely solely on one indicator for trading decisions
Risk Management
* Always use proper risk management and position sizing
* Set appropriate stop-losses for all positions
* Never risk more than you can afford to lose
* Consider the inherent risks of leverage and margin trading
* Diversify your portfolio and trading strategies
Professional Consultation
* Consult with qualified financial advisors before trading
* Consider your tax obligations and legal requirements
* Understand the regulations in your jurisdiction
* Seek professional advice for complex trading strategies
LIMITATION OF LIABILITY
Indemnification
The creator and distributor of this indicator shall not be liable for:
* Any trading losses, whether direct or indirect
* Inaccurate or delayed price data
* System failures or technical malfunctions
* Loss of data or profits
* Interruption of service or connectivity issues
No Warranty
This indicator is provided "as is" without warranties of any kind:
* No guarantee of accuracy or completeness
* No warranty of uninterrupted or error-free operation
* No warranty of merchantability or fitness for a particular purpose
* The software may contain bugs or errors
Maximum Liability
In no event shall the liability exceed the purchase price (if any) paid for this indicator. This limitation applies regardless of the theory of liability, whether contract, tort, negligence, or otherwise.
REGULATORY COMPLIANCE
Jurisdiction-Specific Risks
* Regulations vary by country and region
* Some jurisdictions prohibit or restrict certain trading strategies
* Tax implications differ based on your location and trading frequency
* Commodity futures and options trading may have additional requirements
* Currency trading may be regulated differently than stock trading
Professional Trading
* If you are a professional trader, ensure compliance with all applicable regulations
* Adhere to fiduciary duties and best execution requirements
* Maintain required records and reporting
* Follow market abuse regulations and insider trading laws
TECHNICAL SPECIFICATIONS
Data Sources
* Calculations based on TradingView data feeds
* Data accuracy depends on broker and exchange reporting
* Historical data may be subject to adjustments and corrections
* Real-time data may have delays depending on data providers
Software Limitations
* Internet connectivity required for proper operation
* Software updates may change calculations or functionality
* TradingView platform dependencies may affect performance
* Third-party integrations may introduce additional risks
MONEY MANAGEMENT RECOMMENDATIONS
Conservative Approach
* Risk only 1-2% of capital per trade
* Use position sizing based on volatility
* Maintain adequate cash reserves
* Avoid over-leveraging accounts
Portfolio Management
* Diversify across multiple strategies
* Don't put all capital into one approach
* Regularly review and adjust trading strategies
* Maintain detailed trading records
FINAL LEGAL NOTICES
Acceptance of Terms
* By using this indicator, you acknowledge that you have read and understood this disclaimer
* You agree to assume all risks associated with trading
* You confirm that you are legally permitted to trade in your jurisdiction
Updates and Changes
* This disclaimer may be updated without notice
* Continued use constitutes acceptance of any changes
* It is your responsibility to stay informed of updates
Governing Law
* This disclaimer shall be governed by the laws of the jurisdiction where the indicator was created
* Any disputes shall be resolved in the appropriate courts
* Severability clause: If any part of this disclaimer is invalid, the remainder remains enforceable
REMEMBER: THERE ARE NO GUARANTEES IN TRADING. THE MAJORITY OF RETAIL TRADERS LOSE MONEY. TRADE AT YOUR OWN RISK.
Contact Information:
* Creator: Hitesh_Nimje
* Phone: Contact@8087192915
* Source: Thought Magic Trading
© HiteshNimje - All Rights Reserved
This disclaimer should be prominently displayed whenever the indicator is shared, sold, or distributed to ensure users are fully aware of the risks and limitations involved in trading.

HTCTS - Session & Time LiquidityHTCTS - Session & Time Liquidity
1. ภาพรวมการทำงาน (Overview)
อินดิเคเตอร์ตัวนี้ทำหน้าที่ 4 อย่างหลักพร้อมกัน:
Auto DST (ปรับเวลาตามฤดูอัตโนมัติ): คุณไม่ต้องมานั่งแก้เวลาเมื่อตลาดต่างประเทศเปลี่ยนเวลา (Daylight Saving Time) เพราะโค้ดอ้างอิง Timezone ของตลาดนั้นๆ โดยตรง (เช่น NY ใช้ America/New_York)
Session Bars: แสดงแถบสีเล็กๆ ด้านล่างจอเพื่อบอกว่าตอนนี้อยู่ใน Session ไหน (Asia, London, NY AM, NY PM, Thai) แทนการถมสีพื้นหลังซึ่งอาจจะรกตา
High/Low Levels & Sweeps: เมื่อจบ Session โปรแกรมจะตีเส้น High และ Low ของช่วงเวลานั้นทิ้งไว้ ถ้ากราฟวิ่งไปชนเส้นเหล่านั้น (Breakout/Sweep) เส้นจะเปลี่ยนเป็นเส้นประและขึ้นข้อความว่า "(Swept)"
1. Indicator Overview and Purpose (ICT/SMC Framework)
This custom Pine Script indicator is designed specifically for traders utilizing ICT (Inner Circle Trader) or SMC (Smart Money Concepts) methodologies. Its primary function is to simplify the analysis of Time & Price by automatically defining and tracking key market sessions, their resulting liquidity levels (High/Low), and detecting liquidity sweeps (Stop Hunts).
The indicator is designed to be Zero-Maintenance regarding time zones, as it automatically adjusts for Daylight Saving Time (DST) changes in major financial centers (London, New York).
2. Key Features and Logic
A. Automatic DST Handling (Auto-DST)
The script uses specific, location-based time zones for global markets instead of a fixed GMT/UTC offset.
Asia: Uses Asia/Tokyo.
London: Uses Europe/London (Automatically adjusts for BST).
New York (AM/PM): Uses America/New_York (Automatically adjusts for EST/EDT).
This guarantees that the session times displayed on your chart (regardless of your local time, e.g., Thailand GMT+7) always align with the actual opening and closing moments of the corresponding financial market.

ICT Complete SuiteICT Complete Suite - Advanced SMC & Liquidity Analysis
A comprehensive indicator combining ICT (Inner Circle Trader) methodology with Smart Money Concepts for professional trading analysis.
🔹 KEY FEATURES:
- Market Structure Detection (MSS, CISD, BOS, CHoCH)
- Smart Money Liquidity Analysis (BSL/SSL Sweeps)
- Premium Discount Arrays (Order Blocks, FVG, Breaker Blocks)
- OTE Zones (0.62-0.79 Fibonacci)
- Session & Killzone Tracking (Asian, London, NY)
- Silver Bullet Time Windows
- Real-time Info Dashboard
- Multi-timeframe Support
🔹 MODULES:
1. Market Structure & Trend Analysis
2. Liquidity Hunter (BSL/SSL Detection)
3. PD Arrays (OB, FVG, Breaker Blocks)
4. Sessions & Killzones
Perfect for traders who follow ICT concepts and Smart Money trading strategies.
⚠️ Best on M15-H1 timeframes
⚠️ Compatible with XAUUSD, EURUSD, GBPUSD, and major pairs

SMT Alert MTF [Elykia]SMT Alert MTF - Smart Money Divergence Scanner
Overview
The SMT Alert MTF is an essential productivity tool for traders applying ICT (Inner Circle Trader) and SMC (Smart Money Concepts).
An SMT divergence ("Smart Money Technique") is one of the most powerful signals to confirm a trend reversal or market manipulation. It occurs when two highly correlated assets (e.g., Nasdaq and S&P500) move out of sync.
Instead of monitoring 3 different charts across 5 different timeframes manually, this indicator scans everything in the background and alerts you the moment a divergence appears.
💎 The Strategy: How to trade SMT?
SMT is not a blind entry signal; it is a confirmation tool.
1. The Context: Wait for price to reach a Key Level (POI, Order Block) or perform a Liquidity Sweep.
2. The Signal (Desynchronization):
Bullish SMT: Asset A makes a Lower Low, but correlated Asset B makes a Higher Low (Refusal to go lower). This indicates institutional accumulation.
Bearish SMT: Asset A makes a Higher High, but correlated Asset B makes a Lower High (Weakness). This indicates distribution.
Execution: Once the SMT alert triggers on your timeframe (e.g., M1 or M5), look for a Change of Character (CHoCH) to enter the trade.
Key Features & Benefits
⚡ Multi-Timeframe Scanner (MTF): Monitor up to 5 timeframes simultaneously (e.g., 1m, 5m, 15m, 1h, 4h) on a single chart.
🔄 Smart Asset Detection: The script automatically recognizes your current chart and selects the relevant comparison assets:
Trading NQ (Nasdaq) -> Compares with ES (S&P500).
Trading 6E (Euro) -> Compares with 6B (British Pound).
Trading Gold -> Compares with Silver.
(You can also manually override with any symbol).
👀 Visual Clarity: A divergence line is drawn directly on price action (Red for Bearish, Blue for Bullish) labeled with the divergent ticker.
🔔 Comprehensive Alerts: Set up specific alerts for each timeframe (e.g., "Alert me only for M5 or M15 SMT").
Recommended Settings
1. Enable M1, M5, and M15 timeframes for intraday scalping.
2. Keep the automatic symbol detection enabled for Indices and Futures.
⚠️ DISCLAIMER
This indicator is for educational purposes only. Trading involves a high level of risk. SMT divergences should be used in confluence with other technical analysis factors. The author is not responsible for any financial losses.

One for AllOne for All (OFA) - Complete ICT Analysis Suite
Version 3.3.0 by theCodeman
📊 Overview
One for All (OFA) is a comprehensive TradingView indicator designed for traders who follow Inner Circle Trader (ICT) concepts. This all-in-one tool combines essential ICT analysis features—sessions, kill zones, previous period levels, and higher timeframe candles with Fair Value Gaps (FVGs) and Volume Imbalances (VIs)—into a single, highly customizable indicator. Whether you're a beginner learning ICT concepts or an experienced trader refining your edge, OFA provides the visual structure needed for precise market analysis and execution.
✨ Key Features
- 🏷️ Customizable Watermark**: Display your trading identity with customizable titles, subtitles, symbol info, and full style control
- 🌍 Trading Sessions**: Visualize Asian, London, and New York sessions with high/low lines, range boxes, and open/close markers
- 🎯 Kill Zones**: Highlight 5 critical ICT kill zones with precise timing and visual boxes
- 📈 Previous Period H/L**: Track Daily, Weekly, and Monthly highs/lows with customizable styles and lookback periods
- 🕐 Higher Timeframe Candles**: Display up to 5 HTF timeframes with OHLC trace lines, timers, and interval labels
- 🔍 FVG & VI Detection**: Automatically detect and visualize Fair Value Gaps and Volume Imbalances on HTF candles
- ⚙️ Universal Timezone Support**: Works globally with GMT-12 to GMT+14 timezone selection
- 🎨 Full Customization**: Control colors, styles, visibility, and layout for every feature
🚀 How to Use
Watermark Setup
The watermark overlay helps you identify your charts and maintain focus on your trading principles:
1. Enable/disable watermark via "Show Watermark" toggle
2. Customize the title (default: "Name") to display your trading name or account identifier
3. Set up to 3 subtitles (default: "Patience", "Confidence", "Execution") as trading reminders
4. Choose position (9 locations available), size, color, and transparency
5. Toggle symbol and timeframe display as needed
Use Case: Display your trading principles or account name for multi-monitor setups or content creation.
Trading Sessions Analysis
Sessions define market character and liquidity availability:
1. Enable "Show All Sessions" to visualize all three sessions
2. Adjust timezone to match your local market (default: UTC-5 for EST)
3. Customize session times if needed (defaults cover standard hours)
4. Enable session range boxes to see consolidation zones
5. Use session high/low lines to identify key levels for the current session
6. Enable open/close markers to track session transitions
Use Case: Identify which session you're trading in, track session highs/lows for liquidity, and anticipate session transition volatility.
Kill Zones Trading
Kill zones are ICT's high-probability trading windows:
1. Enable individual kill zones or use "Show All Kill Zones"
2. **Asian Kill Zone** (2000-0000 GMT): Early positioning and smart money accumulation
3. **London Kill Zone** (0300-0500 GMT): European market opening volatility
4. **NY AM Kill Zone** (0930-1100 EST): Post-NYSE open expansion
5. **NY Lunch Kill Zone** (1200-1300 EST): Midday consolidation or manipulation
6. **NY PM Kill Zone** (1330-1600 EST): Afternoon positioning and closes
7. Customize colors and times to match your trading style
8. Set max days display to control historical visibility (default: 30 days)
Use Case: Focus entries during high-probability windows. Watch for liquidity sweeps at kill zone openings and institutional positioning.
Previous Period High/Low Levels
Previous period levels act as magnetic price targets and support/resistance:
1. Enable Daily (PDH/PDL), Weekly (PWH/PWL), or Monthly (PMH/PML) levels individually
2. Set lookback period (how many previous periods to display)
3. Choose line style: Solid (current emphasis), Dashed (standard), or Dotted (subtle)
4. Customize colors per timeframe for visual hierarchy
5. Adjust line width (1-5) for visibility preference
6. Enable gradient effect to fade older periods
7. Position labels left or right based on chart layout
8. Customize label text for your preferred notation
Use Case: Identify key levels where price is likely to react. Daily levels work on intraday timeframes, Weekly on daily charts, Monthly for swing trading.
Higher Timeframe (HTF) Candles
HTF candles reveal the larger market context while trading lower timeframes:
1. Enable up to 5 HTF slots simultaneously (default: 5m, 15m, 1H, 4H, Daily)
2. Choose display mode: "Below Chart" (stacked rows) or "Right Side" (compact column)
3. Customize timeframe, colors (bull/bear), and titles for each slot
4. **OHLC Trace Lines**: Visual lines connecting HTF candle levels to chart bars
5. **HTF Timer**: Countdown showing time remaining until HTF candle close
6. **Interval Labels**: Display day of week (Daily+) or time (intraday) on each candle
7. For Daily candles: Choose open time (Midnight, 8:30, 9:30) to match your market structure preference
Use Case: Trade lower timeframes while respecting higher timeframe structure. Watch for HTF candle closes to confirm directional bias.
FVG & VI Detection
Fair Value Gaps and Volume Imbalances highlight inefficiencies that price often revisits:
1. **Fair Value Gaps (FVGs)**: Detected when HTF candle wicks don't overlap between 3 consecutive candles
- Bullish FVG: Gap between candle 1 high and candle 3 low (green box by default)
- Bearish FVG: Gap between candle 1 low and candle 3 high (red box by default)
2. **Volume Imbalances (VIs)**: Similar detection but focuses on body gaps
- Bullish VI: Gap between candle 1 close and candle 3 open
- Bearish VI: Gap between candle 1 open and candle 3 close
3. Enable FVG/VI detection per HTF slot individually
4. Customize colors and transparency for each imbalance type
5. Boxes appear on chart at formation and remain visible as retracement targets
**Use Case**: Identify high-probability retracement zones. Price often returns to fill FVGs and VIs before continuing the trend. Use as entry zones or profit targets.
🎨 Customization
OFA is built for flexibility. Every feature includes extensive customization options:
Visual Customization
- **Colors**: Independent color control for every element (sessions, kill zones, lines, labels, FVGs, VIs)
- **Transparency**: Adjust box and label transparency (0-100%) for clean charts
- **Line Styles**: Choose Solid, Dashed, or Dotted for previous period lines
- **Sizes**: Control text size, line width, and box borders
- **Positions**: Place watermark in 9 positions, labels left/right
Layout Control
- **HTF Display Mode**: "Below Chart" for detailed analysis, "Right Side" for space efficiency
- **Drawing Limits**: Set max days for sessions/kill zones to manage chart clutter
- **Lookback Periods**: Control how many previous periods to display (1-10)
- **Gradient Effects**: Enable fading for older previous period lines
Timing Adjustments
- **Timezone**: Universal GMT offset selector (-12 to +14) for global markets
- **Session Times**: Customize each session's start/end times
- **Kill Zone Times**: Adjust kill zone windows to match your market's characteristics
- **Daily Open**: Choose Midnight, 8:30, or 9:30 for Daily HTF candle open time
💡 Best Practices
1. Start Simple: Enable one feature at a time to learn how each element affects your analysis
2. Match Your Timeframe: Use Daily levels on intraday charts, Weekly on daily charts, HTF candles one or two levels above your trading timeframe
3. Kill Zone Focus: Concentrate your trading activity during kill zones for higher probability setups
4. HTF Confirmation: Wait for HTF candle closes before committing to directional bias
5. FVG/VI Entries: Look for price to return to unfilled FVGs/VIs for entry opportunities with favorable risk/reward
6. Customize Colors: Use a consistent color scheme that matches your chart theme and reduces visual fatigue
7. Reduce Clutter: Disable features you're not actively using in your current trading plan
8. Session Context: Understand which session controls the market—trade with session direction or anticipate reversals at session transitions
⚙️ Settings Guide
OFA organizes settings into logical groups for easy navigation:
- **═══ WATERMARK ═══**: Title, subtitles, position, style, symbol/timeframe display
- **═══ SESSIONS ═══**: Enable/disable sessions, times, colors, high/low lines, boxes, markers
- **═══ KILL ZONES ═══**: Individual kill zone toggles, times, colors, max days display
- **═══ PREVIOUS H/L - DAILY ═══**: Daily high/low lines, style, color, lookback, labels
- **═══ PREVIOUS H/L - WEEKLY ═══**: Weekly high/low lines, style, color, lookback, labels
- **═══ PREVIOUS H/L - MONTHLY ═══**: Monthly high/low lines, style, color, lookback, labels
- **═══ HTF CANDLES ═══**: Global display mode, layout settings
- **═══ HTF SLOT 1-5 ═══**: Individual HTF configuration (timeframe, colors, title, FVG/VI detection, trace lines, timer, interval labels)
Each setting includes tooltips explaining its function. Hover over any input for detailed guidance.
📝 Final Notes
One for All (OFA) represents a complete ICT analysis toolkit in a single indicator. By combining watermark customization, session visualization, kill zone highlighting, previous period levels, and higher timeframe candles with FVG/VI detection, OFA eliminates the need for multiple indicators cluttering your chart.
**Version**: 3.3.0
**Author**: theCodeman
**Pine Script**: v6
**License**: Mozilla Public License 2.0
Start with default settings to learn the indicator's structure, then customize extensively to match your personal trading style. Remember: tools provide information, but your edge comes from disciplined execution of a proven strategy.
Happy Trading! 📈

ICT Fair Value Gap (FVG) Detector │ Auto-Mitigated │ 2025Accurate ICT / Smart Money Concepts Fair Value Gap (FVG) detector
Features:
• Detects both Bullish (-FVG) and Bearish (+FVG) using strict 3-candle rule
• Boxes automatically extend right until price mitigates them
• Boxes auto-delete when price closes inside the gap (true mitigation)
• No repainting – 100% reliable
• Clean, lightweight, and works on all markets & timeframes
• Fully customizable colors and transparency
How to use:
– Bullish FVG (green) = potential support / buy zone in uptrend
– Bearish FVG (red) = potential resistance / sell zone in downtrend
Exactly matches The Inner Circle Trader (ICT) methodology used by thousands of SMC traders in 2024–2025.
Enjoy and trade safe!

HD Trades📊 ICT Confluence Toolkit (FVG, OB, SMT)
This All-in-One indicator is designed for Smart Money Concepts (SMC) traders, providing visual confirmation and signaling for three critical Inner Circle Trader (ICT) tools directly on your chart: Fair Value Gaps (FVG), Order Blocks (OB), and Smart Money Technique (SMT) Divergence.
It eliminates the need to load multiple indicators, streamlining your analysis for high-probability setups.
🔑 Key Features
1. Fair Value Gaps (FVG)
Automatic Detection: Instantly highlights bullish (buy-side) and bearish (sell-side) imbalances using the standard three-candle pattern.
Real-Time Mitigation: Gaps are drawn until price trades into the FVG zone, at which point the indicator automatically "mitigates" and removes the box, ensuring your chart stays clean.
2. Order Blocks (OB)
Impulse-Based Logic: Identifies valid Order Blocks (the last opposing candle) confirmed by a strong, structure-breaking impulse move, quantified using an Average True Range (ATR) multiplier for dynamic sensitivity.
Mitigation Tracking: Bullish OBs are tracked until broken below the low, and Bearish OBs until broken above the high, distinguishing between active supply/demand zones.
3. SMT Divergence (Smart Money Technique)
Multi-Asset Comparison: Utilizes the Pine Script request.security() function to compare the swing structure of the current chart against a correlated asset (e.g., EURUSD vs. GBPUSD, or ES vs. NQ).
Signal Labels: Plots clear 🐂 SMT (Bullish) or 🐻 SMT (Bearish) labels directly on the chart when a divergence in market extremes is detected, signaling a potential reversal or continuation based on internal market weakness.
⚙️ Customization
All three components are toggleable and feature customizable colors and lookback periods, allowing you to fine-tune the indicator to your specific trading strategy and preferred timeframes.
Crucial Setup: For SMT Divergence to function, you must enter a correlated symbol (e.g., NQ1!, ES1!, or a related Forex pair) in the indicator settings.

A+ Model - Cave EducationHere is a comprehensive and detailed explanation of the "A+ Model - Cave Education" Pine Script code.
This script is a sophisticated technical analysis tool designed for TradingView. It assists traders in identifying specific institutional time windows, price ranges (sessions), and "Macro" volatility periods based on the ICT (Inner Circle Trader) or similar time-based trading concepts.
Below is the breakdown of how the code functions, organized by its logic sections.
1. General Overview
The script is an overlay indicator (it sits directly on the price chart). Its primary purpose is to:
Highlight a specific trading session (The "A+ Box") and mark its High/Low.
Mark key institutional times (07:00 NY and 09:30 NY Open).
Identify "Macro" windows (specific 20-minute periods where algorithms are active) and draw dynamic ranges around them based on volatility (ATR).
Project future times onto the chart to help the trader prepare for the next day.
2. Settings & Inputs (User Configuration)
The code begins by defining a vast array of user inputs, grouped for better usability:
General Time & Box: Allows the user to define the "A+ Session" time (default 20:00-00:00) and the Time Zone (UTC-5/New York). It also handles the visual style (colors) of the session box.
Visibility: A crucial performance and visual clutter setting. boxDays limits how far back the A+ boxes and time lines are drawn (default 14 days). Macros are strictly limited to the current week to prevent chart lagging.
Line & Text Controls: Every visual element (A+ lines, NY markers, Macros) has toggles (input.bool) to show/hide the lines or the text labels separately.
Macro Settings: Defines the time windows for three separate macros and an ATR Multiplier. The ATR multiplier determines how wide the channel lines are drawn around the macro price action.
3. Logic Breakdown by Section
Section 1: The "A+ Draw" Box (Session Range)
This is the core of the A+ Model.
Logic: The script checks if the current bar is within the user-defined sessionTime.
Box Creation:
When the session starts, it initializes a new Box (box.new).
Throughout the session, it continuously updates the Box's Top (Highest High) and Bottom (Lowest Low) to encompass the full range of that time period.
Extension Lines (Support/Resistance):
Once the session ends, the script draws two horizontal lines: one from the Session High and one from the Session Low.
Smart Break Logic: These lines are active (highActive, lowActive). They extend to the right until the price breaks them (High line is broken by a higher price, Low line by a lower price). This helps traders see if the session range is being respected or broken later in the day.
Section 2: Time Lines (NY Midnight & Open)
This section marks vertical reference points.
It checks for specific times: 07:00 and 09:30 (in the user's timezone).
If the current bar matches these times, it draws a vertical line (line.new) covering the High/Low of that bar and places a label (e.g., "NY." or "09:30") above it.
This helps the trader orient themselves regarding the New York session Open and the "Killzone" start.
Section 3: Macros (Volatility Windows)
This is the most complex calculation in the script.
Definition: Macros are specific time windows (e.g., 09:50–10:10) where price delivery is often accelerated.
Visibility Rule: To keep the script fast, this only runs if isCurrentWeek is true.
ATR Offset: The script calculates the Average True Range (ATR). It uses this to create a "channel" around the price.
Drawing Logic:
When a Macro time starts, the script tracks the Highest High and Lowest Low inside that specific 20-minute window.
It draws parallel horizontal lines above and below these prices.
The Twist: The lines are not drawn at the High/Low. They are offset by ATR * Multiplier. This creates a wider "zone" around the macro price action, visually indicating a volatility range.
Section 4: Future Projection (Tomorrow)
This feature is for planning ahead.
It runs only on the last bar of the chart (barstate.islast).
It calculates the timestamps for the next occurrence of the key times (07:00, 09:30, and all three Macros).
It draws vertical lines into the future (empty space on the right of the chart).
Benefit: The trader can see exactly where 09:30 or the next Macro will occur on the timeline before the candles even print.
4. Helper Functions
The code uses custom functions to keep the logic clean:
f_drawFuture(...): A standardized function to draw the future vertical lines and labels so the code doesn't have to repeat itself for every single time marker.
isStartTime(...) & isInTime(...): Shorthand functions to check if the current candle belongs to a specific session string (like "0950-1010").
Summary of Improvements in this Version
Compared to a standard indicator, this script is highly optimized:
Text Control: You can turn off text labels while keeping the lines (or vice versa).
Performance: It limits historical drawing (only 14 days back for boxes, only this week for macros) to prevent "Maximum Line Count" errors in Pine Script.
Visual Clarity: It uses different colors for different Macros (Blue, Red, Orange) to make them instantly distinguishable.
